This series consists of Scientific reports, Technical reports and Final reports issued by the Geophysical Institute on all contracts and grants.
-

Hourly values of the auroral electrojet activity index AE for 1961
Y. S. Wong, Carol Echols, and T. Neil Davis
-

Computed HF auroral backscatter traces for various distances
Howard F. Bates
Computed ionospheric backscatter traces in the HF portion of the radio spectrum are illustrated for a number of distances between the auroral belt and the observing radar. The type, frequency range, and observed scattering height of HF auroral backscatter traces are strongly dependent upon the ionospheric propagation conditions existing between the auroral belt and the observer. Backscatter echoes produced in a given region of space by a single backscattering mechanism can have completely different range versus frequency characteristics when observed at sites located at different distances from the scattering region. Even though a given bank of auroral-belt irregularities extends through both the E and F regions, it is possible that only E-scatter is detected at one distance, and F-scatter at another. Trace type, scattering height, and frequency range of the observed backscatter echoes are strongly dependent upon the distance between the auroral belt and the observer.
-

Results of the HF forward and backscatter program at College since 1963
Howard F. Bates
This report describes the results of the HF backscatter and forward sounding project conducted at College, Alaska, from 1963 to 1966. The primary finding was that with the exception of slant-F, meteor and groundscatter echoes, the oblique backscatter echoes observed from the auroral zone and polar cap ionospheres were produced by the aurora. When combined with satellite data, this result led to the conclusion that the auroral precipitation markedly increases the electron density at all ionospheric heights, and an auroral model incorporating this notion explains most of the observed details of auroral backscatter, and of auroral sidescatter on forward-oblique paths. The absence of groundscatter from beyond the auroral belt is explained as being due, in part, to the enhanced ionization of the E region by the auroral precipitation. Aspect-sensitive auroral backscatter can be obtained from the south as well as from the north in the northern hemisphere. A single sounder installed at each geomagnetic pole could provide real-time information on the position of the auroral precipitation completely about the pole. Auroral morphology studies made from radio data are independent of the weather and the season. An examination of a year’s data shows that no marked difference exists between the behavior of the summer and winter positions of the auroral precipitation; the northern limit of the south boundary of the aurora during the day was found to be approximately 1.5° geomagnetic latitude north of that during the winter. The radio data for 1965 agrees closely with published optical data for the period of 1957 to 1959 when the level of magnetic activity is considered. This finding shows that the position of the southern boundary of the auroral precipitation for a given level of magnetic activity does not depend appreciably upon the level of solar activity. The excellent correspondence between the optical and radio determinations of the auroral position and occurrence rates is added evidence that the radio method provides reliable auroral tracking information.
-

On the strong influence of the F1 layer on medium to high latitude HF propagation
Howard F. Bates and Paul R. Albee
During the recent sunspot minimum of the F1 layer critical frequency was close to that of the F2 in the medium to high latitudes. This considerably modified HF propagation conditions over long distance paths. At times the F1 layer appeared to block off the propagation of signals in the very oblique F2 modes. High order F2 mode signals were frequently strong and were reflected from large virtual heights. This retardation was produced by the dense, thick F1 layer which existed in the medium to high latitudes during the summer of 1964. The maximum radio frequency for the path was frequently determined by the F1 layer; although this effect has been noted by various workers, it has not been taken into account for communications predictions. One particularly strong and highly delayed type of signal is not readily explainable as a higher order F2 mode because it occurred singly. If it were an ordinary F2 mode trace, its occurrence would lead to the conclusion that the only F2 layer signal propagating was a third or fourth order mode signal on paths of 3500 to 5000 km, and such a conclusion is hard to justify. As an alternative, an F1-F2 ducted mode hypothesis is presented.
-

College step sounding equipment, recording systems, and operating parameters from 1963 to 1965
Howard F. Bates and J. A. Teas
-

Noctilucent clouds
Benson T. Fogle
This report contains a detailed account of 4 years of experiments and observations on noctilucent clouds (abbreviation: NLC) organized by the author in North America and in the southern hemisphere as well as a comprehensive summary and discussion of the material published by other researchers. (Abstract excerpt).
-

Aberrations of VHF-UHF signals traversing the auroral ionosphere
Edward J. Fremouw
This final report summarizes an investigation of radiowave scattering in the auroral ionosphere, based on observations of radio-star and satellite signals. The observations were carried out near solar minimum and are compared with radio-star observations performed near the previous solar maximum. Results show that 223 MHz scintillations of the radio-star Cassiopeia A declined from the start of the current observations in 1962 through the winter of 1964-65. Subsequently, scintillations on 223 MHz have continuously increased. Observations at 137 MHz, begun in 1965, also have shown continuously increasing scintillation. Both radio-star and satellite scintillations have shown a nighttime maximum and a daytime minimum in their diurnal variations, showing little change from the diurnal pattern found near solar maximum. Satellite scintillation at 136 MHz has shown the statistical center of the scattering zone to be north of Fairbanks, Alaska (geomagnetic latitude, 65°N), during 1965-66. A close relation of severe satellite scatter events and radio-star visibility fades, on the one hand, to visible auroral luminosity, on the other, has been found. In addition, strong refraction of satellite signals has been found to occur near auroral arcs, with angular deviations up to at least 7° being observed at 137 MHz. Quantitative predictions are made regarding the severity of scatter effects to be expected during the next solar maximum on VHF and UHF satellite communications links in the auroral zones.
-

Radiowave scattering structure in the disturbed auroral ionosphere : some measured properties
Edward J. Fremouw
A technique for quantitative description of radiowave scattering structure in the disturbed auroral ionosphere is developed in this work. Application is made by means of multi-spacing interferometric observations of a radio star. The work is based on the observed fact that sufficient scattering causes a measurable decrease in correlation of output voltages from neighboring antennas. Such correlation decreases are called visibility fades herein and have been called long-duration fades and radio-star fadeouts by other workers. Random noise theory is employed, and it is assumed that the angular spectrum of the source, as received at the ground after scattering, is randomly phased. However, the usual assumption of a Gaussian autocorrelation function to describe the scattering structure is circumvented, and provision is made for the existence of quasi-periodic structure. Further, the usual assumption of weak (single) or strong (multiple) scatter is avoided. The statistical characteristics of amplitude, phase, and complex signal are developed for the general case of arbitrary degree of scatter, using a numerical method. The technique is applied to observations with phase-switch and phase-sweep interferometers, yielding two important parameters of the received wavefront, the coherence ratio and the wavefront auto-correlation function. The coherence ratio is defined as the ratio of nonscattered to scattered flux received from the source. The wavefront autocorrelation function is defined as the spatial autocorrelation function of the scattered portion of the (complex) wavefront. Two quantities which describe the ionospheric scattering region are obtained from the coherence ratio and wavefront autocorrelation function. First, the optical depth of the region (considered as a purely scattering medium) is determined from the coherence ratio. Second, the ionospheric structural autocorrelation function is established jointly from the wavefront autocorrelation function and the optical depth, yielding a statistical description of the average size and idealized shape of the ion-density irregularities which produced the scattering. Forty-nine visibility fades observed at College, Alaska, between November of 1964 and February of 1966, inclusive, are analyzed. A majority of the fades revealed optical depths in excess of unity at 68 MHz. Optical depth is numerically equal to mean-square fluctuation in radio-frequency phase across a plane at the base of the scattering region, so the fades were characterized by rms phase deviations in excess of one radian at 68 MHz. An approximately inverse-square dependence of optical depth on frequency was obtained from simultaneous observations at 68, 137, and 223 MHz. At 68 MHz, tri-spacing observations were carried out on east-west baselines of 110 meters (25 λ), 220 meters (50 λ), and 330 meters (75 λ). The observations seldom were consistent with the demands of a Gaussian autocorrelation function, as is commonly assumed. Rather, the disturbed auroral ionosphere displays evidence of quasi-periodic structure in the dimensional range of tens and hundreds of meters. The structure observed is comparable in size to auroral rays. While most of the observations were consistent with the assumption of a randomly phased angular spectrum, a significant minority was not. Quantitative results could not be obtained in these instances, and they imply the existence of highly developed quasi-periodicity. Theoretical work is needed to bridge the gap between quasi-periodic structure in the sense of random-noise theory and strict periodicity. Narrow-beam photometers were mounted on one of the interferometer antennas tracking the radio star. Auroral luminosity was recorded along the line of sight during 100% of the visibility fades which occurred at night under clear-sky conditions and during many night-time fades which occurred under cloudy conditions Thus, VHF radio-star visibility fades in the auroral zone result from scattering by irregularities directly associated with auroral forms, at least at night.
-

Sea ice strength
H. R. Peyton
This report contains the results from a study of the mechanical and structural properties of sea ice; the study commenced in 1958 and was completed in late 1965. Most of the experimental work is based upon stress-strain tests in both direct compression and direct tension. Approximately 3800 of these tests were made. Those parameters anticipated to have significant effect upon strength were measured: temperature, salinity, rate of loading, crystal size, crystallographic orientation, history of the ice and depth in the ice sheet. All of these are found to be significant except that the history factor itself tended to be determined by the other parameters. The analysis was accomplished primarily by the testing of models by linear multiple regression. The models selected yield good results with multiple correlation coefficients between 0.70 and 0.98 over a range of petrofabric types. Sea ice is shown to be complex and its description requires five classifications of petrofabric types, each of which exhibit somewhat different characteristics. The load rate proved to be a highly significant parameter in both strength and stiffness in most cases. Ice failing in tension is somewhat less sensitive to load rate than is ice in compression. The interrelated effects of salinity and temperature were studied using the brine volume concept. This study yielded positive confirmation of the brine volume concept, evidence of solid salt reinforcement, and evidence of failure plane selectivity to bypass strongly reinforced planes. These aspects pertain to both tension and compression failure modes. Depth in the ice sheet is shown to be a strength factor when related to each of three parameters; rate of loading, brine volume and solid salt reinforcement. Additional work accomplished in conjunction with construction of large offshore oil drilling platforms had provided significant information concerning oscillatory failure of sea ice in compression and strength reduction at very high load rates. The ice failure force oscillation is an ice property and is not primarily a function of the response of the structure. The amplitude of oscillation is large and at a frequency in the range of most space frame structures. The failing ice may cause forced resonant vibration in structures, and the forces are large enough to resonantly vibrate structure weighing several thousand tons.
-
Geophysical Institute Annual Report 1965-66
University of Alaska Fairbanks. Geophysical Institute
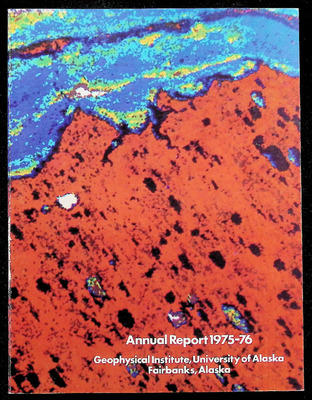
The 1965–66 Geophysical Institute Annual Report presents an overview of the year’s scientific research achievements across the Institute’s disciplines, alongside operational summaries covering finances, administrative changes, and other key activities.
-

Scale changing and spectral analysis of analog chart records
Eugene M. Wescott
Data which are contained only in the form of a trace on a strip chart record or on film often may not be fully utilized because of the time and difficulty required for conversion to other forms for analysis. A device is described herein for manually trace following chart records to produce an electrical analog signal. The output signal may be recorded on a strip chart to produce desired amplitude or time scale changes. Time variations of spectral content may be measured by recording the output on a slow speed tape recorder—then speeding up the playback for sonograph analysis. These techniques have been found useful for rapid and inexpensive analysis of analog chart records such as magnetograms.
-

Tracking the aurora by a multifrequency HF backscatter sounder
H. F. Bates, A. E. Belon, G. J. Romick, and W. J. Stringer
A comparison of simultaneous optical and radio auroral data obtained during 12 days in December, 1964, shows conclusively that the radio wave scattering belt includes the visual auroral belt. The optical data were obtained with the Alaskan network of all-sky-cameras located between 65 and 80° north geomagnetic latitude. With the exception of vertical incidence, meteor, groundscatter, and slant F (polar spur) traces, all of the recorded backscatter traces from the north were scaled indiscriminately for slant range. The excellent agreement that resulted leads us to conclude that the majority of the HF and low VHF backscatter echoes observed at high latitudes are auroral echoes in the strict sense of the term. In the records shown the auroral belt was tracked from 65 to above 80°N geomagnetic latitude. It is concluded that the multifrequency HF backscatter sounder makes year-round observations of the auroral belt possible.
-

The determination of the diurnal variation of the auroral belt by radio means
Howard F. Bates
Backscatter echoes in the high frequency portion of the radio spectrum exhibit a systematic southward movement in the evening and northward in the morning. Typically, the scattering belt lies about 78°N geomagnetic latitude during the day, and moves south to 65 to 70° at night. The extent of the southward movement correlates strongly with geomagnetic activity and, to a lesser degree, local time. No significant difference was found between summer and winter diurnal variations of the scattering belt. The scattering belt has been found to include the optical auroral belt; thus, it is concluded that there is no significant difference in the diurnal variation in the position of the summer and winter auroral belts for given levels of magnetic disturbance. The scattering belt was present on the College magnetic meridian during most of the two and one-half years’ observations. This is interpreted as showing the optical auroral belt existed most of the time somewhere on the College meridian, and hence on others as well. Thus, the auroral belt during the solar activity minimum period existed as a more or less closed curve around the geomagnetic pole. When the latitudinal effects are considered versus local time, the auroral belt takes the form of an oval curve, the northernmost portion approximately on the noon meridian. The size of the oval at any time is proportional to the size of the disturbance. The scattering belts as determined from simultaneous College and Thule backscatter soundings over approximately reciprocal paths generally coincided. This result shows that simultaneous soundings in four to eight directions from the magnetic pole could be used to map the auroral belt completely around the earth at any given time.
-

Ice Fog: Low Temperature Air Pollution; Defined with Fairbanks, Alaska as type locality
Carl S. Benson
Stable pressure systems over interior Alaska sometimes produce prolonged, extreme (below -40°C) cold spells at the surface. The meteorological conditions responsible for two such cold spells are discussed in detail in Appendix A, where it is shown that the rate of radiative cooling of the air is enhanced by suspended ice crystals which are themselves a result of the initial cooling. Radiation fogs formed during the onset of cold spells are generally of short duration because the air soon becomes desiccated. These fogs consist of supercooled water droplets until the air temperature goes below the "spontaneous freezing point” for water droplets (about -40°C); the fog then becomes an ice crystal fog, or simply "Ice Fog". During the cooling cycle water is gradually condensed out of the air until the droplets freeze. At this point there is a sharp, discontinuous decrease in the saturation vapor pressure of the air because it must be reckoned over ice rather than over water. The polluted air over Fairbanks allows droplets to begin freezing at the relatively high temperature of -35°C. Between -35 and -40°C the amount of water vapor condensed by freezing of supercooled water droplets is 3 to 5 times greater than the amount condensed by 1°C of cooling at these temperatures. This results in rapid and widespread formation of ice fog (Appendix B) which persists in the Fairbanks area as long as the cold spell lasts. The persistence of Fairbanks ice fog depends on a continual source of moisture (4.1 x 10⁶ Kg H₂O per day) from human activities within the fog. Ice fog crystals are an order of magnitude smaller than diamond dust, or cirrus cloud crystals, which in turn are an order of magnitude smaller than common snow crystals (0.01, 0.1 and 1 to 5-mm respectively). The differences in size are shown to result from differences in cooling rates over 5 orders of magnitude. Most of the ice fog crystals have settling rates which are slower than the upward velocity of air over the city center. The upward air movement is caused by convection cells driven by the 6°C "heat island" over Fairbanks. This causes a reduced precipitation rate which permits the density of ice fog in the city center to be three times greater than that in the outlying areas. The inversions which occur during cold spells over Fairbanks begin at ground level and are among the strongest and most persistent in the world. They are three times stronger than those in the inversion layer over Los Angeles. Thus, the low-lying air over Fairbanks stagnates and becomes effectively decoupled from the atmosphere above, permitting high concentrations of all pollutants. The combustion of fuel oil, gasoline, and coal provides daily inputs of: 4.1 x 10⁶ kg CO₂ ; 8.6 x 10³ kg SO₂ ; and 60, 46 and 20 kg of Pb, Br and Cl respectively, into a lens-like layer of air resting on the surface with a total volume less than 3 x 10⁹ m³. The air pollution over Fairbanks during cold spells couldn't be worse, because the mechanisms for cleaning the air are virtually eliminated while all activities which pollute the air are increased.
-

Dynamo action in the ionosphere and motions of the magnetospheric plasma
Ronald N. DeWitt
This thesis presents a study of the dynamic interaction which takes place between the magnetospheric plasma and the underlying neutral atmosphere; it is hoped thus to gain a better understanding of the effects of this interaction upon the steady state configuration of the magnetosphere. The neutral portion of the atmosphere (the neutrosphere) and the overlying ionized regions (the upper atmosphere and magnetosphere) may be regarded as two distinct dynamic domains that interact in a region of transition occurring between 100 and 150 km over the earth. The neutrosphere because of its greater mass will dominate the motion, and the magnetospheric plasma can be expected to undergo motions related to those of the upper neutrosphere and transition region. However, the geomagnetic field restricts the motion of the magnetospheric plasma to a particular class, allowing one to consider the magnetospheric motion to be constrained. Motions in the transition region of the class not permitted the magnetospheric plasma will give rise to forces against the constraint. The reaction of the constraint on the atmosphere of the transition region takes the form of a Lorentz force J x B where J is the current responsible for the well known solar quiet day daily magnetic variation (Sq). The explanation for the production of this current in the transition region has traditionally been presented in terms of a dynamo-like electromotive force generated by motions of the conducting atmosphere through the magnetic field, whence the transition region is aptly named the dynamo region. The Lorentz force represented by this current constitutes a significant term in the equation of motion for the dynamo region. Another important term arises from eddy viscous stresses immediately below the dynamo region. The equation of motion for the dynamo region must thus include such forces as well as the pressure gradient and Coriolis terms. However, our almost total ignorance of the eddy viscous stress field at the lower surface of the dynamo layer at present precludes our deducing the entire dynamo layer winds from the observed Sq magnetic variation. The kinematics of the dynamo layer are discussed and the motion or the dynamo layer is divided into a symmetric and an antisymmetric part. The term symmetric is here used to describe winds in the northern and southern hemisphere that are the mirror images of each other with respect to the equatorial plane. It is demonstrated that the symmetric component gives rise to electrostatic fields transverse to the field lines, but to no currents along the field lines, while the antisymmetric case produces the converse effects. The symmetric and antisymmetric winds are further divided into components according to the horizontal electromotive force they produce. (a) Symmetric Wind. In the case of the symmetric wind, only the portion of the wind producing the solenoidal component of the horizontal dynamo electromotive force is effective in producing ionospheric currents. It is demonstrated that only this current producing wind system acts against the constraints imposed by the geomagnetic field on magnetospheric motions. The motion of the magnetospheric plasma driven by each such wind system is discussed. The earlier treatments of the dynamo theory consider the dynamo region to be a single layer in which the wind system and the electric conductivity are assumed to be uniform in height. A new, more general derivation of the layer's dynamo action is given in which no restrictions are placed upon the vertical distributions. An effective wind is defined which permits the use of the earlier equations relating the current function, the electrostatic field, and the scalar field describing the current producing part of the effective wind. The equation relating the electrostatic field and the current function is essentially that employed by Maeda (1956), allowing his solution for the portion of the electrostatic field associated with the current producing wind to remain unaffected by the stratification of the wind system. Mathematical techniques for solving the dynamo equations for the electrostatic field are developed. These allow for a quite general conductivity distribution over the globe, only requiring that it be expressible in surface harmonics. The effect of undetected zonal currents upon the solution for the electrostatic field is discussed. It is suggested that a considerable diurnal component of electrostatic field and other components as well may be hidden from us by our inability to detect the prevailing magnetic perturbations produced by zonal currents. The electrostatic field associated with the non-current producing components of the symmetric wind is likewise hidden from us. (b) Antisymmetric Wind. The equations for the current driven by the antisymmetric component of wind are derived, and some of the effects of such currents are discussed. It is found that the conduction of current along the field lines from one hemisphere to the other is associated with an interhemispheric stress between geomagnetically conjugate points of order 3 x 10⁻⁷ newtons/meter². In addition it is found that an antisymmetric layer current density of 5 amperes/km into the polar cap region (across the 75° latitude circle) might give rise to a displacement of about 150 km in the relative position of the conjugate points defined by field lines of the magnetospheric tail. It is suggested that the dynamo action in the 100 to 150 km height plays a role in determining the manner in which the magnetosphere divides itself into the corotating region and the magnetospheric tail.
-

Noctilucent clouds : a survey with special reference to recent observations
Benson Fogle, Sydney Chapman, and Carol Echols
-

College step sounding equipment, recording systems, and operating parameters from 1963 to 1965
Arthur E. Goddard and Howard F. Bates
-

Effective recombination coefficient in D-region
R. Parthasarathy and D. B. Rai
The effect of the meteoric dust particles on the steady state distribution of electrons and ions in the lower ionosphere (50-90 km) has been investigated. It is shown that the effective recombination coefficient obtained is higher than that obtained by ignoring the presence of dust. (Abstract excerpt.)