
-

Economic Effects of Climate Change in Alaska
Matthew Berman and Jennifer Schmidt
We summarize the potential nature and scope of economic effects of climate change in Alaska that have already occurred and are likely to become manifest over the next 30-50 years. We classified potential effects discussed in the literature into categories according to climate driver, type of environmental service affected, certainty and timing of the effects, and potential magnitude of economic consequences. We then described the nature of important economic effects, and provided estimates of larger, more certain effects for which data were available. Largest economic effects were associated with costs to prevent damage, relocate, and replace infrastructure threatened by permafrost thaw, sea level rise, and coastal erosion. The costs to infrastructure were offset by a large projected reduction in space heating costs attributable to milder winters. Overall, we estimated that five, relatively certain, large effects that could be readily quantified would impose an annual net cost of $340-$700 million, or 0.6 to 1.3 percent of Alaska GDP. This significant, but relatively modest net economic effect for Alaska as a whole obscures large regional disparities, as rural communities face large projected costs while more southerly urban residents experience net gains.
-

Win or Lose: Residential Sorting After a School Choice Lottery
Andrew Bibler and Stephen Billings
We examine residential relocation and opting out of the public school system in response to school choice lottery outcomes. We show that rising kindergarten and sixth graders who lose a school choice lottery are 6 percentage points more likely to exit the district or change neighborhood schools (20-30% increase) and make up 0.14-0.35 standard deviations in average school test scores between lottery assignment and attendance the following year. Using hedonic-based estimates of land prices, we estimate that lottery losers pay a 9-11% housing price premium for access to a school with a one standard deviation higher mean test score.
-

Trends in Alaska's Health-Care Spending
Rosyland Frazier, Mouhcine Guettabi, and Jessica Passini
All Americans spend a lot to get health care—but Alaskans spend the most per resident, face the highest insurance premiums, and have seen overall spending grow much faster. Here we highlight some trends in Alaska’s health-care spending since the 1990s, based on existing publicly available data that allow us to compare changes in Alaska and nationwide. A chart book with much more detail is available on ISER’s website. We hope this broad information on trends in health-care spending will help Alaskans better understand what happened, consider possible reasons why, and think about potential ways to change the upward spiral.
-

History and Options Regarding the Unfunded Liabilities of Alaska’s Public Employees’ and Teachers’ Retirement Systems
Cliff Groh
In early 2003, financial analysts working for the State of Alaska announced that the two largest public employee retirement systems in Alaska had become significantly underfunded.3 From fiscal year 2006 (July 1, 2005 through June 30, 2006) to date, the state has paid $6.951 billion— (an average of $534.7 million annually)—to pay down these obligations, which will be called “unfunded liabilities” in this paper.4 The State of Alaska has substantial unfunded liabilities remaining to pay off for these two systems, the Public Employees’ Retirement System (PERS) and the Teachers’ Retirement System (TRS). There is uncertainty about the size of these unfunded liabilities, and there are also different ways of calculating them. For example, the State of Alaska’s snapshot balance-sheet approach, subtracting the accrued liabilities from the assets, based on their actuarial value, produces an estimate of $6.609 billion for the combined unfunded liabilities of PERS and TRS.5 That figure is an estimate of the unfunded liabilities discounted to the present day. Estimates of the size of the unfunded liabilities particularly vary based on the use of different critical assumptions, such as the rate of future returns on investment. As an example, using an estimated rate of return of 2.142 percent instead of the State of Alaska’s assumption of 8 percent produces an estimate of $33.9 billion for the state’s unfunded liabilities. 6 The State of Alaska has committed to paying off the unfunded liabilities under a 25-year amortization schedule that started in 2014, so another highly relevant measurement of those liabilities appears to be the amount actuaries for the state currently project will be needed under that pay-off plan, which runs through fiscal year 2039. The state’s actuaries project that from fiscal year 2019 through fiscal year 2039 the state will pay a total of $10.815 billion in extra contributions—called “state assistance” or “additional state contributions” in this paper—to pay off the unfunded liabilities. 7 In contrast to the state’s snapshot estimate of $6.609 billion, this estimate of $10.815 billion in state assistance represents a flow of annual cash payments. That is, the $10.815 billion is an estimate of the total amount needed to eliminate the unfunded liabilities of PERS and TRS under the 25-year amortization schedule the state adopted in 2014. 4 Note that this state assistance is above and beyond the amount the state is projected to owe in its role as employer in the normal course of funding the two systems.8 Employers other than the state—primarily local governments and school districts—also participate in PERS and TRS, and the figure for state assistance covers not only unfunded liabilities attributed to the state but also a portion of the unfunded liabilities attributed to non-state employers. As explained more later, the state has assumed, by statute, the responsibility to pay for a share of the unfunded liability of these other employers. 9 This paper: • Describes the structure of the Alaska public employee retirement systems in the context of some unusual features of public employment on the Last Frontier • Reviews how the problem of unfunded liabilities came about • Examines how concerns over unfunded liabilities produced both changes and proposed changes in the retirement systems over the past dozen years, including proposals for changes in the allocation of burdens between the state and local governments in paying for retirement benefits • Describes current projections of future amounts needed to pay off the unfunded liabilities • Discusses how future estimates of the unfunded liabilities might change in response to economic and demographic factors • Discusses legal provisions protecting the rights of beneficiaries of the retirement systems • Lays out options for policymakers—other than the current policy of paying down the unfunded liabilities over time—including buyout, bailout, and bankruptcy
-

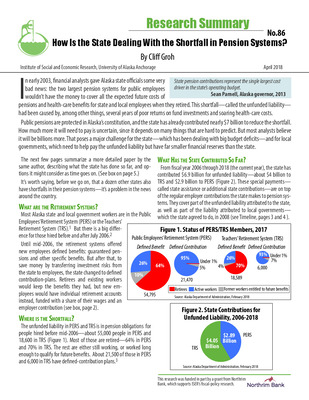
How Is the State Dealing With the Shortfall in Pension Systems?
Cliff Groh
I n early 2003, financial analysts gave Alaska state officials some very bad news: the two largest pension systems for public employees wouldn’t have the money to cover all the expected future costs of pensions and health-care benefits for state and local employees when they retired. This shortfall—called the unfunded liability— had been caused by, among other things, several years of poor returns on fund investments and soaring health-care costs. Public pensions are protected in Alaska’s constitution, and the state has already contributed nearly $7 billion to reduce the shortfall. How much more it will need to pay is uncertain, since it depends on many things that are hard to predict. But most analysts believe it will be billions more. That poses a major challenge for the state—which has been dealing with big budget deficits—and for local governments, which need to help pay the unfunded liability but have far smaller financial reserves than the state.
-

A short brief on the regional dimensions of the Alaska recession
Mouhcine Guettabi
We provide a short update on the Alaska recession by examining its regional dimensions. Specifically, we evaluate the performance of the Alaska boroughs/census areas in each of the last three years and determine which areas have been resilient and which ones continue losing jobs.
-

How do oil prices influence Alaska and other energy-dependent states?
Mouhcine Guettabi
We analyze monthly data from the Bureau of Labor and Statistics to evaluate how fluctuations in oil prices affect economic activity in Alaska and other energy-dependent states. For this most recent recession, we find that only 6 of the traditional oil states experienced a recession. Four of those have already recovered, leaving Alaska and North Dakota as the only two to continue losing jobs. Using monthly employment data between 1991 and 2018 we estimate that, on average, the long run effect of a 10% change in oil prices results in a 1.7% change in employment across the five most important oil states. When analyzed individually, we find that some of them experience symmetric responses to oil price increases and decreases while others are much more sensitive to price declines.
-
How Has the 80th Percentile Rule Affected Alaska's Health-Care Expenditures?
Mouhcine Guettabi
We use the Health Expenditures by State of Residence data (1991-2014) compiled by Centers for Medicare & Medicaid Services to examine the causal effect of the 80th percentile rule on Alaska's health care expenditures. We find evidence that Alaska's expenditures would have been lower in the absence of rule. The share of the overall increase in expenditures that we attribute to the 80th percentile rule is between 8.61% and 24.65%. It is important to note that using expenditures as a proxy for costs has limitations as it is the product of both quantity of services used and prices.
-

What do we know to date about the Alaska recession and the fiscal crunch?
Mouhcine Guettabi
We provide a broad overview of the state’s economic and fiscal conditions. We show how the economic contraction has spread away from natural resource and mining and state government to household spending dependent sectors. We also show that while the rate at which jobs are being lost has slowed, it is inaccurate to think about that as a sign of a recovery. That is because the engine of growth that is O&G employment as of June 2017 was only 75% of what it was in 2014. Additionally, the softness in spending activity may linger for an extended period of time. We also assess the regional effects of the recession and show the significant heterogeneity in experience. Unsurprisingly, areas with economic bases not associated with Oil and Gas and with relatively little dependence on state government spending are holding up best. After establishing an understanding of the economic conditions, we offer a back of the envelope calculation of the capital investment losses associated with the fiscal uncertainty. Then, we provide a comparison of Alaska’s taxes relative to the rest of the US, and a simulation of the effects of different withdrawal amounts on the permanent fund balance and the earnings reserve.
-

Perceptions of Universal Ballet Delivery Systems
Virgene Hanna and Jessica Passini
A total of 412 registered voters in the Bethel, Dillingham, and Kusilvak Census Areas completed surveys with ISER interviewers in March and April of 2018. The majority (74%) of respondents reported their race as Alaska Native and 13% were White. Near the beginning of the survey, interviewers asked respondents how they preferred to receive their ballot and 60% said they preferred to get it in person on Election Day, 21% would prefer to receive it by mail, and 17% would prefer to receive their ballot online. After respondents heard a description of three voting methods being considered: 1) keep voting the way it is now; 2) mail out and mail back; and 3) receive ballot in the mail and have different ways to return it their preferences changed somewhat. Of the three methods, keep voting the way it is now was the first choice by 49% of respondents, followed by 36% for option 3, and 14% for option 2. Respondents had little experience with voting methods other than in-person. When asked what made it difficult for them and other members of their community to vote, personal reasons, such as being sick or out of town, was the most frequent (37%) response. About two-thirds (64%) reported personal reasons made it difficult for people in their community to vote followed by 46% saying that the ballot being written in English made it difficult for people in their community. Over half (56%) of respondents reported they are satisfied with their mail service, only 17% of those who were satisfied said they would prefer to receive or return their ballot by mail.
-
Perceptions of Universal Ballot Delivery Systems
Virgene Hanna and Jessica Passini
A total of 412 registered voters in the Bethel, Dillingham, and Kusilvak Census Areas completed surveys with ISER interviewers in March and April of 2018. The majority (74%) of respondents reported their race as Alaska Native and 13% were White. Near the beginning of the survey, interviewers asked respondents how they preferred to receive their ballot and 60% said they preferred to get it in person on Election Day, 21% would prefer to receive it by mail, and 17% would prefer to receive their ballot online. After respondents heard a description of three voting methods being considered: 1) keep voting the way it is now; 2) mail out and mail back; and 3) receive ballot in the mail and have different ways to return it their preferences changed somewhat. Of the three methods, keep voting the way it is now was the first choice by 49% of respondents, followed by 36% for option 3, and 14% for option 2. Respondents had little experience with voting methods other than in-person. When asked what made it difficult for them and other members of their community to vote, personal reasons, such as being sick or out of town, was the most frequent (37%) response. About two-thirds (64%) reported personal reasons made it difficult for people in their community to vote followed by 46% saying that the ballot being written in English made it difficult for people in their community. Over half (56%) of respondents reported they are satisfied with their mail service, only 17% of those who were satisfied said they would prefer to receive or return their ballot by mail.
-

2018 Alaska's Construction Spending Forecast
Linda Leask and Oliver Scott Goldsmith
The total value of construction spending “on the street” in Alaska in 2018 will be $6.6 billion, up 4% from 2017.1, 2,3 The increase is due to a recovery in Petroleum sector spending which will grow 15% to $2.6 billion from its low of $2.2 billion last year. All other construction spending will be $4.0 billion, a decline of 2% from $4.1 billion last year. Private spending, excluding petroleum, will be about $1.5 billion, down 5% from $1.6 billion last year—while public spending will decline 1% to $2.5 billion. Wage and salary employment in construction will decline 3% to 14.5 thousand.4 After falling by half in the last two years, spending by the petroleum industry will start to recover because of the rise in the price of oil, and more support for the industry from the federal and state governments.
-

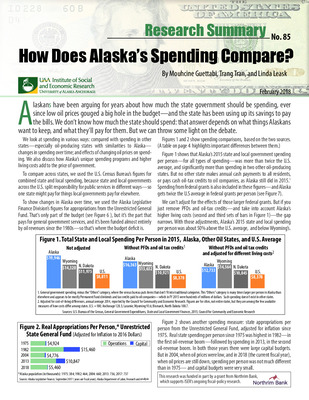
How Does Alaska's Spending Compare?
Linda Leask, Trang Tran, and Mouhcine Guettabi
A laskans have been arguing for years about how much the state government should be spending, ever since low oil prices gouged a big hole in the budget—and the state has been using up its savings to pay the bills. We don’t know how much the state should spend: that answer depends on what things Alaskans want to keep, and what they’ll pay for them. But we can throw some light on the debate.
-

Mechanisms matter for evaluating the economic impacts of marine reserves
Matthew Reimer
Large areas of marine and coastal environments have been protected to satisfy diverse policy goals, but there has been limited work understanding the economic impacts of such closures. While methods for establishing causal impacts are prevalent, less attention has been paid to explaining the mechanisms through which the causal relationship came to be. Understanding mechanisms is crucial for designing policies that foster the mechanisms that achieve the intended objectives of marine reserves and mitigate the mechanisms that do not. We estimate the treatment effect of a large marine reserve on the net earnings of a commercial fishery using difference-in-differences and synthetic-control designs, and decompose the treatment effect into its constituent mechanisms through structural equation modeling. We find minimal evidence that closing the marine reserve to fishing had a significant economic cost for the industry; however, several counteracting mechanisms are critical for explaining the effect and for generalizing to other settings.
-

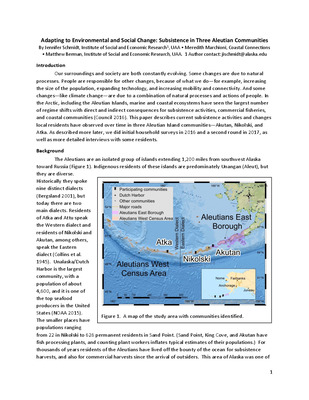
Adapting to Environmental and Social Change: Subsistence in Three Aleutian Communities
Jennifer Schmidt and Matt Berman
-

Adapting to Environmental and Social Change: Subsistence in Three Aleutian Communities
Jennifer Schmidt and Matthew Berman
Our surroundings and society are both constantly evolving. Some changes are due to natural processes. People are responsible for other changes, because of what we do—for example, increasing the size of the population, expanding technology, and increasing mobility and connectivity. And some changes—like climate change—are due to a combination of natural processes and actions of people. In the Arctic, including the Aleutian Islands, marine and coastal ecosystems have seen the largest number of regime shifts with direct and indirect consequences for subsistence activities, commercial fisheries, and coastal communities (Council 2016). This paper describes current subsistence activities and changes local residents have observed over time in three Aleutian Island communities—Akutan, Nikolski, and Atka. As described more later, we did initial household surveys in 2016 and a second round in 2017, as well as more detailed interviews with some residents.
-
Local Knowledge and Science: Observation of Landscape Change in the Nuiqsut Homelands
Jennifer Schmidt and Gary Kofinas
-

The Cost of SBIRT Implementation in Mat-Su Primary Care Practices
Trang C. Tran, Mouhcine Guettabi, Rosyland Frazier, Diane King, and Amanda Zold
The purpose of this report is to calculate the cost of alcohol Screening, Brief Intervention, and Referral to Treatment (SBIRT) in three primary care practices located in the Matanuska-Susitna area. Using Fleming et al. (2000)’s benefit-cost ratio of screening and brief physician advice in managed care settings, we estimated the dollar benefits potentially generated by SBIRT services.
-

Energy Costs and Rural Alaska Out-Migration
Matthew Berman
This report contains results of a formal statistical analysis of the association of high prices for home heating fuel with out-migration from rural Alaska communities, using data from Alaska Permanent Fund Dividend applications from 2003 to 2015. Although anecdotal reports have described hardships caused by the rising cost of fuel, this study is the first to subject the hypothesis of fuel-related out-migration to rigorous statistical testing. This study addressed five main research questions: 1. What is the evidence that out-migration from rural Alaska communities was associated with fuel prices? 2. How sensitive are out-migration rates to fuel prices? 3. Does the effect of high prices on out-migration in communities with the chronically high fuel prices differ from the effect across all communities of high-cost years? 4. How do effects of fuel prices on out-migration differ for regional hubs and smaller villages? 5. How does the magnitude of the effect of fuel prices compare to that of other drivers of mobility, such as employment and income? The study region was defined as the area of western and northern Alaska with neither road nor year-round water access. We divided this region into local areas consisting of the nine Census Areas/Boroughs in the region with the regional hub communities of Dillingham, Bethel, Nome, Barrow/Utqiagvik, and Kotzebue separated from smaller villages in their respective Census Areas/Boroughs. The statistical analysis examined five binary variables representing different types of potential moves that an individual could make outside the local area of residence: 1. Leave rural Alaska (yes or no, all residents of the rural region); 2. Leave the local area (yes or no, all residents of the rural region); 3. If leave the local area, leave rural Alaska: (yes or no, residents leaving local area); 4. If leave a village, leave rural Alaska: (yes or no, residents leaving local area who started in a smaller village and not a regional hub); 5. Leave rural Alaska (yes or no, regional hub residents only) Logistic regression equations were estimated for residents 18 years old to associate each of the five binary variables with fuel prices, controlling for age, gender, employment status and earnings, as well as several characteristics of the community of residence. Teachers, oil workers, mining workers, and pilots were excluded from the analysis. Alaska Department of Labor staff used the applicant’s Social Security Number to link individual Permanent Fund Dividend (PFD) applications across successive years and to 2 state employment security records. Data from PFD applications included age and gender, as well as place of residence. Employment records included earnings by occupation and industry. Retail fuel price surveys conducted by the Alaska Housing Finance Corporation and the Alaska Division of Community and Regional Community Affairs provided price data for home heating fuels. Fuel prices for communities not included in the surveys were estimated from wholesale diesel fuel prices published in Power Cost Equalization program reports. Additional community level data on labor force size, employment, and earnings supplemented data from individual records. Earnings and fuel prices were adjusted to 2015 dollar values using the Anchorage Consumer Price Index. The study found that high fuel prices were associated with more rural Alaska residents moving to urban Alaska, but the size of the effect was relatively small: less than 40 adults each year for each $1 rise in fuel prices. Observed increases in moves to urban Alaska triggered by higher fuel prices came entirely from regional hubs rather than from smaller villages. Although rural Alaska residents were more likely to move from both villages and regional hubs when fuel prices rose, higher fuel prices diverted more village movers to hubs instead of urban areas, so there was a negligible net effect from villages to urban Alaska. Other factors besides fuel prices that change over time also affect migration decisions. The study found that local labor market conditions, as well as the individual’s employment status and earnings had much stronger effects on out-migration than fuel prices.
-

Effect of Alaska Fiscal Options On Children and Families
Matthew Berman and Random Reamey
Alaska’s state government faces an unprecedented challenge, with the need to close an estimated $3 billion gap between projected revenues and expenditures in fiscal year 2017. Total unrestricted state General Fund revenue in fiscal year 2016 (the 12 months ending June 30, 2016) was $1.3 billion, or about $1,800 per resident. That was barely more than the state dispenses annually to Alaska school districts, to support public education (Alaska Office of Management and Budget, Enacted Fiscal Summary). Despite low oil prices and declining production, petroleum revenues still accounted for 72 percent of these funds (Alaska Revenue Sources Book, Fall 2016, Alaska Department of Revenue, Tax Division). Alaska is the only state that does not have either state income or sales taxes. It is clear that Alaskans will soon have to accept some form of broad-based revenue measure to enable continued funding of basic public services. A 2016 analysis by ISER researchers discussed the potential effects on Alaska’s economy and households of various options to reduce expenditures and increase revenues.1 That study examined how the effects of revenue measures varied for Alaska households with different levels of income. These same revenue measures and expenditure cuts are also likely to have a much bigger effect on some households than others, depending on the presence and number of children in the family. This study extends the previous analysis by specifically examining how different options would be likely to affect families and children. Many large expenditures in the state budget can easily be identified as specifically benefiting children. These include state-funded programs such as the Alaska Public School Foundation program and the Division of Juvenile Justice and Office of Children’s Services, for example, as well as joint federal-state programs such as Medicaid and Denali Kidcare. Less obvious are the effects on children of potential measures to fund these and other state expenditures. This study focuses on describing and quantifying the effects of alternative state revenue options on Alaska families and children. In addition to considering how the revenue measures might affect families with children compared to households without children, we also consider how the burden of each measure might differ for rural and urban families.
-

The Allocation of Time and Risk of Lyme: A Case of Ecosystem Service Income and Substitution Effects
Kevin Berry, Jude Bayham, Spencer Meyer, and Eli Fenichel
Forests are often touted for their ecosystem services, including outdoor recreation. Historically forests were a source of danger and were avoided. Forests continue to be reservoirs for infectious diseases and their vectors�a disservice. We examine how this disservice undermines the potential recreational services by measuring the human response to environmental risk using exogenous variation in the risk of contracting Lyme Disease. We find evidence that individuals substitute away from spending time outdoors when there is greater risk of Lyme Disease infection. On average individuals spent 1.54 fewer minutes per day outdoors at the average, 72 U.S. Centers for Disease Control and Prevention, confirmed cases of Lyme Disease. We estimate lost outdoor recreation of 9.41 h per year per person in an average county in the Northeastern United States and an aggregate welfare loss on the order $2.8 billion to $5.0 billion per year.
-

Dual language Education And Student Achievement
Andrew Bibler
Dual language classrooms provide English language learners (ELLs) an opportunity to receive instruction in their native language in hopes of easing the transition to English fluency, and provide an opportunity for native English speakers to receive instruction in a second language. For ELLs, learning in their native language could improve achievement by helping them build a stronger foundation in core subjects, but could also have a negative impact through delayed growth in English skills. For native English speakers, communication barriers could hurt achievement, but many argue that mental stimulation from speaking two languages leads to greater cognitive growth. Empirical testing for the e↵ect of dual language education on academic achievement is necessary to inform the debate on the practice of dual language education, and to inform policymakers and practitioners on practices for assimilating students with non-English dominant languages. I examine dual language education and student achievement using school choice lotteries from Charlotte-Mecklenburg School District, finding local average treatment e↵ects on math and reading exam scores of more than 0.06 standard deviations per year for participants who were eligible for English second language (ESL) services or designated limited English proficient (LEP). There is also some evidence that attending a dual language school led to a lower probability of having limited English proficient status starting in third grade. For applicants who were not eligible for ESL services or designated as LEP, attending a dual language school resulted in higher end of grade exam scores of about 0.09 and 0.05 standard deviations per year in math and reading, respectively.
-

Household Composition and Gender Differences in Parental Time Investments
Andrew Bibler
Recent research documents a female advantage in several important long-term outcomes among children raised in single-parent households, and highlights the importance of non-cognitive skills for explaining these gaps. Understanding the source of differences in non-cognitive skills is complicated due to the presence of many interrelated and often unobservable inputs. One potential explanation for such gaps is that boys and girls receive different levels of inputs in single-parent versus two-parent households. This paper provides empirical evidence that input levels change differentially by gender across household structures and hence may facilitate gender gaps in noncognitive skills. Using data from the Panel Study of Income Dynamics and accompanying Child Development Supplement, I estimate gender differences in parental time investments, defined as the amount of time parents spend participating in activities with the child, around changes in household composition. I find that, although both boys and girls experience reductions in parental time investments following a change from a two-parent to single-mother household, boys experience a larger reduction than girls. The largest difference is found in fathers’ time investments on weekdays, for which boys lose an additional 24 minutes per day (35% of average paternal weekday investments). Moreover, there is little to no evidence that single mothers compensate for the loss by increasing time investments to boys relative to girls.
-

Public and Private Sector Earnings in Alaska
Andrew Bibler and Mouhcine Guettabi
We compare earnings in the Alaska public and private sector labor markets from 2001 -2016. Public sector laborers are older and more likely to be female, suggesting that taking these differences into consideration will be important in our comparisons. We also focus on the public-private sector earnings gaps for men and women separately, as the magnitude and even direction of the gap depends on this distinction. We go about this in three ways: unconditional comparisons, conditional earnings gaps, and comparing the earnings and growth of individuals who remain with the same employer. Below are the main findings: • The unconditional average public-private earnings gaps for men and women are of opposing signs (see Table 1). – Men in the public sector earn about $2,129 less in quarterly wages than men in the private sector, on average. – Women in the public sector earn about $498 more in quarterly wages than women in the private sector, on average. • On average, across all occupations, men and women have higher initial earnings in the private sector at the beginning of a job spell. – For men, the difference is $3113 in quarterly earnings. – For women, the difference is $760 in quarterly earnings. • Among workers who remain with the same employer, earnings growth is 1% and 2% higher in the public sector for men and women, respectively. • For men, despite the faster growth, they don’t catch up to the earnings of private sector employees within 10 years of tenure in most occupations (See Tables 9 and 11, and Figure 12). 1 • Women in the public sector earn more than their private sector counterparts within a few years of tenure, on average. • There is substantial heterogeneity in the earnings gap across occupations (See Tables 10 and 12, and Figure 13).
Printing is not supported at the primary Gallery Thumbnail page. Please first navigate to a specific Image before printing.