
-

Determinants of the Cost of Electricity Service in PCE Eligible Communities
Mark Foster and Ralph Townsend
This report is one of two companion reports ISER prepared for the Alaska Energy Authority. The other report, “True Cost of Electricity in Rural Alaska and True Cost of Bulk Fuel in Rural Alaska,” is dated October 26, 2016. That report estimates the full costs of providing electricity in rural Alaska, including the costs of subsidies provided to lower the price consumers pay. This second report assesses how the costs of electric generation in Power Cost Equalization (PCE) communities are or might be affected by three factors that are not related to the differences in electricity generation costs. Those three factors are the organizational structures of utilities, postage stamp rate design, and managerial information available on energy subsidy programs. 1. Organizational Structures of Utilities Electric utilities in PCE communities are organized as cooperatives, are run by local villages and municipalities, or are investor-owned utilities. The scale of these utilities varies widely, and includes regional utilities that manage separate electric grids in multiple communities. A review of those organizational structures indicates that: 1.1. There are significant differences in distribution, customer service, and general and administrative costs (DCG&A) across utilities. These differences are correlated with the utility size and organizational structure, with the smallest utilities having significantly higher DCG&A costs per kWh. 1.2. Small local utilities that have merged with larger regional utilities have benefited from reduced costs and professional management. Incentives to encourage small local utilities to join larger, more efficient regional utilities should be considered. 1.3. The cost of borrowing for large local and regional electric coops remains low compared with that for stand-alone local villages, municipalities, and investor-owned utilities. 1.4. The state government should consider allowing a return on equity as an allowable expense within the PCE cost of service [AS 42.45.110(a)] to enable utilities to build equity, enhance debt coverage and facilitate the expanded use of private capital, and reduce dependency on limited public capital resources. This private capital may take the form of investor capital for investor-owned utilities or member capital for cooperatives. 2. Postage Stamp Rate Designs 2.1. Postage stamp rate designs—a single rate for electricity for some set of customers—can help reduce costs and improve affordability in smaller, remote communities through an implicit cost subsidization from customers in larger communities. 4 2.2. The subsidies in postage stamp rates may decrease incentives for utilities to manage their costs, because higher costs may be subsidized by postage stamp rate-making. 2.3. The increase in cost in subsidy-providing communities risks inefficient bypass by large commercial or government users. This could increase the total cost of electric service and leave the remaining customers with higher rates and diminished affordability. Separating communities into rate groups according to their cost structure may mitigate, but not eliminate, the risk of self-generators bypassing the local electric utility. 3. Efficiency in Governance of Energy Subsidy Systems 3.1. To assess whether the PCE program is achieving its goals, transparent information about the allocation of the subsidies and about the operation of the subsidized utilities is required. The companion report to this one identified some issues about reliability of information generated under the current reporting system. Improvements in the reporting requirements could address these issues. A common issue is inconsistency in accounting for capital that state and federal agencies contribute to utilities. Those capital contributions include both grants or low-interest loans to finance capital projects as well as sources of short-term government financing, such as annual fuel loans, emergency loans, and write-offs of operating loans for troubled utilities. If capital investments for generation were separated from other capital, investments to reduce fuel costs (such as wind power) could be assessed more directly. 3.2. The PCE program is one of several programs that subsidize energy costs in rural Alaska, and an understanding of the interaction among these programs is required. An annual compilation of all state and federal heating and electrical subsidy support systems by community would enable better understanding of both individual program impact and also the collective programmatic impact of the subsidies on energy affordability. 3.3. Information on system reliability, usually measured as outage hours, is required to fully assess utility performance. 3.4. Currently, there is no information on how well the PCE program and other energy subsidy programs in rural Alaska target families and communities that face the greatest energy affordability challenges. Because of limitations on income data in small rural Alaska communities, assessing how well subsidies are targeted may be challenging. However, in light of general information that energy subsidies are often inefficient at poverty reduction, this is an important question. 3.5. The environmental impact of energy subsidies for rural Alaska, including the PCE program, through CO2 emissions and PM 2.5 emissions, has not been assessed.
-

2017 Alaska's Construction Spending Forecast
Oliver Scott Goldsmith and Pamela Cravez
The total value of construction spending “on the street” in Alaska in 2017 will be $6.5 billion, down 10% from 2016.1, 2,3 Oil and gas sector spending will fall 15% to $2.4 billion, from $2.9 billion last year. All other construction spending will be $4.0 billion, a decline of 7% from $4.3 billion last year. Private spending, excluding oil and gas, will be about $1.6 billion, up 2% from last year—while public spending will decline 12% to $2.5 billion. Wage and salary employment in the construction industry, which dropped by 8.5% in 2016 to 16.2 thousand, will drop another 7.4% in 2017 to 15 thousand, the lowest level in more than a decade.n 2016 the Alaska economy slipped into a recession that is expected to continue at least through 2017. Total wage and salary employment fell in 2016 by 6.8 thousand, about 2%. This year it is anticipated the decline will be 7.5 thousand, or 2.3%, which will return the economy to the 2010 level.5. Weakness in the economy is also reflected in a net outmigration of population over the last four years.
-

A Regional Assessment of Borough Government Finances And Employment
Mouhcine Guettabi
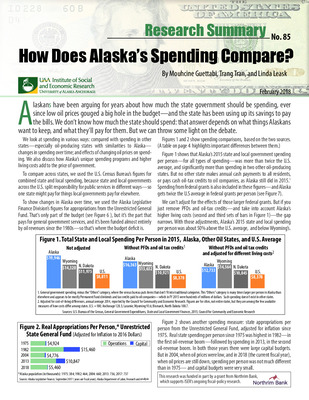
Alaska’s state budget revenues declined by more than 90% from 2012 to 2016, mainly due to a sharp drop in oil prices: oil revenues have paid for most state government operations since the 1980s. This loss of so much revenue has led to a shortfall of billions of dollars in the state budget and a sluggish economy. The health of a state’s tax revenues is critical to its economic growth and ability to finance public services. Considerable attention has been paid to the state’s fiscal woes, which are still ongoing. But the state also provides considerable support to Alaska’s local governments—and there has been little analysis of how the decline of state revenues might affect local governments. This analysis reports how much Alaska’s 19 borough governments rely on state aid—individually and as a group—and considers how vulnerable they are to cuts in state aid as time goes on. Alaska also has city governments, both within and outside organized boroughs, but here we look only at borough governments —which are essentially regional governments that, unlike cities, all have the same mandatory powers. We want to emphasize that our figures are estimates; boroughs report their revenues quite differently, and sometimes in ways that make it nearly impossible to identify allocations from the state. Alaska provides three main kinds of aid to local governments: aid for general government operating expenses (revenue sharing), grants for public works projects, and aid for schools. It has mostly relied on its oil wealth to fund that aid to local governments. Revenue sharing helps ensure that all areas of the state can pay for basic public services and have reasonably equitable and stable local tax rates. Aid to schools is a major part of the state’s budget, and it pays for a large share of school costs. State grants for local capital projects can vary sharply by year. In the years when oil prices were high—much of the time between 2008 and 2012—those grants were large. Since then, the state capital budget has shrunk to a small fraction of what it was a few years back.
-

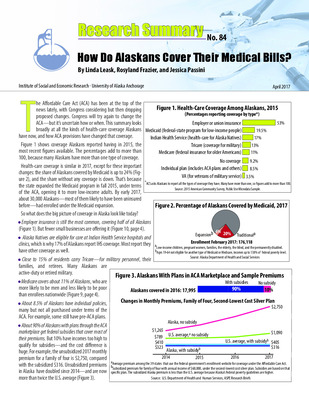
How Do Alaskans Cover Their Medical Bills?
Linda Leask, Rosyland Frazier, and Jessica Passini
The Affordable Care Act (ACA) has been at the top of the news lately, with Congress considering but then dropping proposed changes. Congress will try again to change the ACA—but it’s uncertain how or when. This summary looks broadly at all the kinds of health-care coverage Alaskans have now, and how ACA provisions have changed that coverage.
-

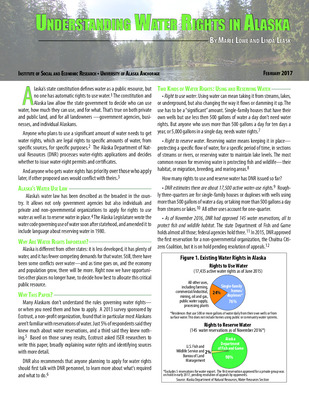
Understanding Water Rights in Alaska
Linda Leask and Marie Lowe
Alaska’s state constitution defines water as a public resource, but no one has automatic rights to use water.1 The constitution and Alaska law allow the state government to decide who can use water, how much they can use, and for what. That’s true on both private and public land, and for all landowners —government agencies, businesses, and individual Alaskans. Anyone who plans to use a significant amount of water needs to get water rights, which are legal rights to specific amounts of water, from specific sources, for specific purposes.2 The Alaska Department of Natural Resources (DNR) processes water-rights applications and decides whether to issue water-right permits and certificates. And anyone who gets water rights has priority over those who apply later, if other proposed uses would conflict with theirs.3
-

The economic impact of the Liberty Oil Project A focus on employment and wages during the construction phase
Bob Loeffler and Mouhcine Guettabi
We analyze the employment and wages effects that will stem from the construction phase of the Liberty project in Alaska. These economic impacts were generated using inputs provided by Hilcorp. We used a standard input output model –IMPLAN– to estimate the ripple effects from the employment and wages directly associated with the project. We find the following: - Direct employment peaks in 2020 at around 300 annualized jobs. - Direct wages also peak in 2020 at 40 million dollars. - Total direct employment from 2017 to 2023 is 1,019 jobs. - Total direct wages from 2017 to 2023 are about 141 million dollars. - Total direct wages including benefits and burdens are about 201 million dollars. 1 - The total employment- including direct, indirect, and induced- from the Liberty project between 2017 and 2023 is expected to be close 2,700. - The total wages-indirect and induced- in 2017 dollars from the construction phase add up to 247 million dollars. - Our results focus on the onsite construction phase of the project and therefore only provide a partial picture of the full range of effects. For example, prolonging the life of the pipeline has broad effects on revenues and employment that we do not try to address. - We also do not look at the engineering and construction and transportation of drilling and production facilities, of which some portion may be constructed in Alaska.
-

Local Jobs and Income from Mineral Exploration
Bob Loeffler and Jennifer Schmidt
Institute of Social and Economic Research • University of Alaska Anchorage • January 2017 From 2002 until 2013, the Pebble Mineral Exploration Project explored a big deposit of mostly copper, but also gold and molybdenum, in the Bristol Bay region of Southwest Alaska, about 17 miles northwest of Illiamna (Figure S-2). That exploration stopped in 2013, when a major project partner withdrew. But before that, developers spent millions of dollars, and in the last years of exploration annually employed more than a hundred residents of Bristol Bay communities. This paper describes jobs and income the residents of 18 communities—in the Lake and Peninsula Borough, the Bristol Bay Borough, and the Dillingham census area—got from 2009 through 2012, the last full year of exploration. Most residents of these communities are Alaska Native, and the communities are small—most with populations considerably smaller than 500— except for Dillingham, where nearly 2,500 people live (Table S-1). How local communities can capture more economic benefits from rural resource projects is an important question in Alaska, and the Pebble exploration project offers a useful case study. But we want to emphasize that we’re neither advocating nor opposing a potential mine at the Pebble site. The proposed mine has been enormously controversial in Alaska and elsewhere, because of its proximity to the world-class Bristol Bay salmon fisheries. We looked only at local jobs and income exploration created, to shed light on the potential for resource development projects to help rural economies. Our analysis is based on data from Pebble Limited Partnership’s exploration-site database, augmented with information from contractors. What did we find? • About 43% of those who worked at the Pebble exploration site anytime from 2009 through 2012 were from the Bristol Bay area. That amounted to about 300 local residents who worked at the site some time during the study period (and may have held more than one job over the years). Another 37% of workers were from elsewhere in Alaska, and the remaining 20% were mainly from other states or Canada (Figure S-1). • The number of workers from Bristol Bay increased over the study period, and so did employee retention. In 2009, 111 local residents worked at the Pebble site, increasing to 157 by 2012. More employees also stayed on the job from one year to the next, with retention at just over half from 2009 to 2010, climbing to two-thirds from 2011 to 2012 (Figure S-3). • Bristol Bay residents worked at 56 kinds of jobs in the study period, almost all seasonal. The most common jobs they held were drill helper, bear guard, and skilled laborer. The average hourly pay was about $19, and most workers earned on average about $15,000 a year from those mostly seasonal jobs. About 65% of workers were men and 35% women (Figure S-3). 2 • Communities closest to the exploration site got several times more jobs and income than those farther away. We grouped the study communities into three regions, based on their proximity to Pebble. Communities closest to the site are mostly around Lake Iliamna, and on average per year about 100 workers came from what we call the Lakes region. About 25 a year were from the 3 Intermediate region and 8 from the Distant. On average, workers from the Lakes region collected a total of nearly $1.5 million a year, compared with $499,000 for those from the Intermediate region and $100,000 among those from the Distant region, where communities are more than 100 miles from the Pebble site (Figures S-2 and S-4). • In the Lakes region, where communities are very small (Table S-1) exploration employment was a large share of total employment: approximately 14% of the total workforce from Lakes communities worked at the site during the study period. The regions farther from the exploration site, which have larger populations, saw much smaller employment effects: 3% of the total workforce from the Intermediate region and barely above 0% from the Distant region. • Even within individual regions, community employment at Pebble varied significantly. Iliamna, where exploration operations were based, and Newhalen (with road access to Iliamna) had the most employees—an annual average of 40 in Newhalen and about 25 in Iliamna, followed by Nondalton with about 16. Outside the Lakes region, the only community with more than an average of 10 workers a year was Koliganek. But even within the Lakes region, not all communities had a significant number of workers—Port Alsworth and Pedro Bay had fewer workers than some places in the Distant region (Figure S-5). 4 • To get a sense of what Pebble income meant to the region, we compared it with income from two important sources: commercial fishing and Permanent Fund dividends. The exploration project brought more income into the Lakes region from 2009 through 2012 than did either commercial salmon fishing or Permanent Fund dividends. But the Intermediate and Distant regions have more people, rely more on salmon fishing, and had fewer residents working at Pebble—so Pebble pay in those regions was a much smaller source of income. As Figure S-6 shows, income from Pebble in the Lakes region from 2009-2012 was several times more than from salmon fishing and two-thirds more than from Permanent Fund dividends. By contrast, in the Intermediate region Pebble pay was significantly less that from either commercial fishing or PFDs—and in the Distant region it was an insignificant amount compared with the other sources. What can the Pebble case study tell us about the potential for rural development projects to benefit local economies? • Residents of Bristol Bay communities and other Alaska places were able to capture a big share of exploration jobs and income. During the study period, 43% of workers were from Bristol Bay communities and another 37% were from elsewhere in Alaska. A number of things contributed to this high local-hire rate, including Pebble’s local hire coordinator; its work with the state government to get training programs and with non-profits to help qualify local residents for jobs; and its contracts with local Native village corporations and other businesses. • Jobs and income going to Bristol Bay residents increased significantly between 2009 and 2012. Partly that’s because the developer was spending more for exploration, creating more jobs. But the number of qualified job applicants from the Bristol Bay region also increased over time. Pebble personnel report that by 2010 or 2011, there were more qualified Bristol Bay residents looking for jobs than there were jobs available. • Proximity made a difference: even though most project employees from all communities were housed at project headquarters in Iliamna, residents from the villages closest to the project site got more jobs. From 2009 through 2012, an average of about 100 residents per year from the Lakes region worked at the project site—about 14% of the total workforce from seven small villages. Prospective workers from places farther away may have taken into account how difficult it would be to travel home for time off work
-

Motorized Access and Moose Harvest in Alaska: 25 years in game management unit 20B
Jennifer Schmidt
Moose hunting is a popular activity in Alaska enjoyed by a wide variety of people. Hunting provides personal satisfaction and cultural identity, as well as food for both urban and rural residents. As the human population grows, All Terrain Vehicle (ATV) technology improves, and development encroaches into currently less accessible areas of Alaska, hunting pressure on moose populations will likely increase. Our current understanding of how increased ATV access may affect harvest is limited. Understanding the relationship between hunter access and harvest is crucial as potential road development to access natural resources around Alaska will increase areas available for ATV access. The area near Fairbanks has seen substantial growth since 1990 both in number of people (77,720 in 1990 and 97,581 in 2010) and in construction of access routes. This research project will examine how much increase in motorized vehicle access over 25 years influenced moose harvest while controlling for other factors such as moose density, topography, and vegetation. The goal is to determine how road and ATV trail access may have influenced moose hunting in Game Management Unit (GMU) 20B, north of the Tanana River near Fairbanks, and to develop a model which could be applied to other areas of Alaska.
-

Identifying the Potential for Cross-Fishery Spillovers: A Network Analysis of Alaskan Permitting Patterns, Working Paper, Resources for the Future
Ethan T. Addicott, Kailin Kroetz, Matthew Reimer, James N. Sanchirico, Daniel K. Lew, and Justine Huetteman
Many fishermen own a portfolio of permits across multiple fisheries, creating an opportunity for fishing effort to adjust across fisheries and enabling impacts from a policy change in one fishery to spill over into other fisheries. In regions with a large and diverse number of permits and fisheries, joint-permitting can result in a complex system, making it difficult to understand the potential for cross-fishery substitution. In this study, we construct a network representation of permit ownership to characterize interconnectedness between Alaska commercial fisheries due to cross-fishery permitting. The Alaska fisheries network is highly connected, suggesting that most fisheries are vulnerable to cross-fishery spillovers from network shocks, such as changes to policies or fish stocks. We find that fisheries with similar geographic proximity are more likely to be a part of a highly connected cluster of susceptible fisheries. We use a case study to show that preexisting network statistics can be useful for identifying the potential scope of policy-induced spillovers. Our results demonstrate that network analysis can improve our understanding of the potential for policy-induced cross-fishery spillovers.
-

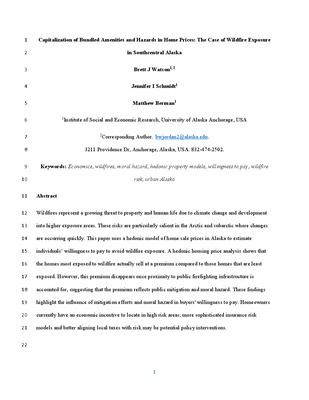
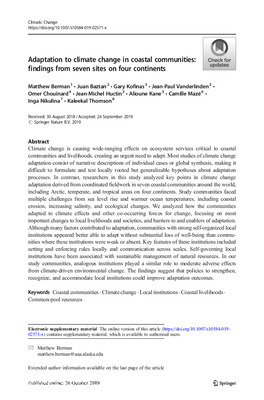
Chapter 6: Vegetation
Matthew Berman, Robert DeVelice, Teresa Nettleton Hollingsworth, Elizabeth Bella, Matthew L. Carlson, Paul Clark, Tara Barrett, Gregory D. Hayward, John Lundquist, Dawn Robin Magness, and Tobias Schwoerer
This assessment evaluates the effects of future climate change on a select set of ecological systems and ecosystem services in Alaska’s Kenai Peninsula and Chugach National Forest regions. The focus of the assessment was established during a multi-agency/organization workshop that established the goal to conduct a rigorous evaluation of a limited range of topics rather than produce a broad overview. The report explores the potential consequences of climate change for: (a) snowpack, glaciers, and winter recreation; (b) coastal landscapes and associated environments, (c) vegetation, (d) salmon, and (e) a select set of wildlife species. During the next half century, directional change associated with warming temperatures and increased precipitation will result in dramatic reductions in snow cover at low elevations, continued retreat of glaciers, substantial changes in the hydrologic regime for an estimated 8.5 percent of watersheds, and potentially an increase in the abundance of pink salmon. In contrast to some portions of the Earth, apparent sealevel rise is likely to be low for much of the assessment region owing to interactions between tectonic processes and sea conditions. Shrubs and forests are projected to continue moving to higher elevations, reducing the extent of alpine tundra and potentially further affecting snow levels. Opportunities for alternative forms of outdoor recreation and subsistence activities that include sled-dog mushing, hiking, hunting, and travel using across-snow vehicles will change as snowpack levels, frozen soils, and vegetation change over time. There was a projected 66-percent increase in the estimated value of human structures (e.g. homes, businesses) that are at risk to fire in the next half century on the Kenai Peninsula, and a potential expansion of invasive plants, particularly along roads, trails, and waterways.
-

Alaska 1332 Waiver - Economic Analysis
Andrew Bibler
The four guardrails that a successful 1332 waiver must meet are as follows: 1. Coverage - There must be at least a comparable number of individuals with coverage under the waiver as would have had coverage without the waiver. 2. Affordability – The waiver should not result in an increase in out-of-pocket spending required of residents to obtain coverage, relative to income. 3. Comprehensiveness – The waiver should not decrease the number of individuals with coverage that meets the essential health benefits (EHB) benchmark. 4. Deficit Neutrality – The waiver should not have any negative impact on the federal deficit. In this report, the first three guardrails are briefly discussed to reaffirm that the actuarial analysis conducted by Oliver Wyman demonstrates that the proposed waiver meets them. The actuarial report from Oliver Wyman projects that the proposed waiver will increase the number of individuals taking up insurance in the individual market, lower average premiums, and have no impact on the comprehensiveness of coverage. The numbers reported in the actuarial analysis are then used to help evaluate the impact that the proposed waiver will have on the federal budget.
-

Alaska 1332 Waiver- Economic Analysis
Andrew Bibler
The four guardrails that a successful 1332 waiver must meet are as follows: 1. Coverage - There must be at least a comparable number of individuals with coverage under the waiver as would have had coverage without the waiver. 2. Affordability – The waiver should not result in an increase in out-of-pocket spending required of residents to obtain coverage, relative to income. 3. Comprehensiveness – The waiver should not decrease the number of individuals with coverage that meets the essential health benefits (EHB) benchmark. 4. Deficit Neutrality – The waiver should not have any negative impact on the federal deficit. In this report, the first three guardrails are briefly discussed to reaffirm that the actuarial analysis conducted by Oliver Wyman demonstrates that the proposed waiver meets them. The actuarial report from Oliver Wyman projects that the proposed waiver will increase the number of individuals taking up insurance in the individual market, lower average premiums, and have no impact on the comprehensiveness of coverage. The numbers reported in the actuarial analysis are then used to help evaluate the impact that the proposed waiver will have on the federal budget. There are at least four ways in which the waiver will have an important impact on the federal budget, which are summarized in Table 1. Table 1: Impact of Proposed Waiver on Budget Direction of Effect APTC Savings + Individual Shared Responsibility Payments - Health Insurance Providers Fee - Federal Exchange User Fees - Overall Impact on Budget + The first and most important impact of the waiver is that it will lead to a reduction in premiums. The reduction in premiums reduces the amount of Advanced Premium Tax Credits (APTC) that individuals will be eligible for and generates savings of $50 - $100 million per year from 2018 through 2026. There are also three routes through which the waiver will negatively impact the budget by decreasing revenue: individual shared responsibility payments, health insurance providers fees, and federal exchange user fees. Because the waiver will lead to more individuals taking up insurance in the individual market, fewer individuals will owe 2 Attachment 4 Alaska 1332 Waiver - Economic Analysis December 23, 2016 the individual penalty for not having health insurance. The health insurance providers fee depends on the amount of premiums aggregated to the national level. Because the waiver depresses premiums in the Alaska individual insurance market, it will have a secondary negative effect on the total amount collected through the providers fee for years 2019 through 2026. Lower premiums also reduce the amount collected in federal exchange user fees, a 3.5% tax imposed on premiums sold through the Federally Facilitated Marketplace. The aggregate impact on the budget is positive, because the APTC savings outweigh the combined negative impact of the other three channels. Table 2 summarizes the aggregate impact of the four components on the federal budget. Year Final Savings 2016 $0 2017 $0 2018 $48,973,684 2019 $52,260,336 2020 $56,108,411 2021 $61,486,732 2022 $65,612,013 2023 $72,213,851 2024 $77,717,467 2025 $84,814,665 2026 $91,785,506 Table 2: Estimated Savings from Waiver (Before Pass-Through Funding) The overall impact through these four components is about $49 million in savings in 2018. Savings increase in every year thereafter, reaching nearly $92 million in 2026. The savings listed in Table 2 are before the granting of any pass-through funding, so they suggest that as long as pass-through funding is less than or equal to these figures, the proposed waiver will meet the federal deficit neutrality requirement.
-

True Cost of Electricity in Rural Alaska and True Cost of Bulk Fuel in Rural Alaska
Steve Colt
In this analysis, we compile data from several sources to estimate the true cost of electricity in rural Alaska. The true cost includes expenses listed on the utilities’ books plus costs paid by other entities in the form of explicit and implicit subsidies. Our focus is on the nonfuel costs of power. Fuel costs are quite volatile and are tracked carefully by AEA on a monthly basis. The concept of “Fuel cost” typically includes the price paid at the point of delivery into a bulk storage tank. We do include here as contributed resources the estimated subsidies to the fuel delivery system for electricity due to provision of bulk fuel storage by, for example, the Denali Commission.
-

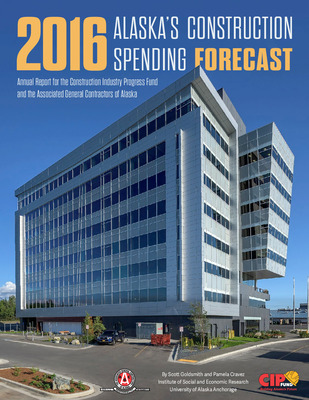
2016 Alaska's Construction Spending Forecast
Oliver Scott Goldsmith and Pamela Cravez
The total value of construction spending “on the street” in Alaska in 2016 will be $7.3 billion, down 18% from 2015.1,2,3 Oil and gas sector spending will fall 25% to $3.1 billion from its record level of $4.2 billion last year. All other construction spending will be $4.2 billion, a decline of 11% from $4.7 billion last year. Private spending, excluding oil and gas, will be about $1.4 billion, down 24% from $1.8 billion last year—while public spending will decline 6% to $2.8 billion from $2.9 billion. Wage and salary employment in the construction industry, which increased an estimated 6 percent last year to almost 18,000, will decline slightly in 2016.4 The decline in construction spending in Alaska in 2016 can be traced directly to the precipitous drop in the price of oil over the last 18 months, after the previous period of unprecedented high prices a few years earlier. In mid- 2014 the price was above $110 per barrel, but as this report is being written the price has fallen below $30 for the first time in 12 years. Furthermore, the short-term outlook is for the price to remain low, or even decline further, because supply continues to outstrip demand and inventories continue to accumulate. The longer term outlook for price also continues to fall, because of the resilience of production in the face of the falling price. The high price stimulated increases in construction spending across all sectors of the Alaska economy, particularly among oil and gas companies and the state government. The low price is now beginning to reduce construction spending within the economy, except for federal spending and spending by basic industries that benefit from lower oil prices. So far the price drop has been felt most directly in the oil and gas sector. Although many companies announced optimistic investment programs for 2016, most, if not all, have recently announced cutbacks or postponements. The longer the price remains low, the greater the likelihood of further cutbacks in the oil patch. Because of the oil price drop, a deficit of $2 billion opened in the state general fund in FY2014, and it has increased to $3.5 billion for each of the last two years. Although the state has been fortunate to have sufficient cash reserves to offset this revenue shortfall in the short term, it has meant a dramatic decline in new state funding for capital projects. Whereas the general fund capital appropriation in FY2013 was more than $2 billion, in this past year it was only enough to cover the required match on federal transportation grants. And looking ahead, there is very little prospect for a significant increase in the capital budget in the coming years. But the sharp decline in the state capital budget over the last three years has so far had limited effects on construction spending. This is because it takes considerable time for appropriated funds to become “cash on the street.” Several billion dollars of capital appropriations remain “in the pipeline,” which will keep state spending from falling dramatically this year. However, the amount of construction spending will be winding down in many communities like Juneau, Kodiak, and Fairbanks (excluding Eielson Air Force Base) because of declining state spending. Because of the size of the state budget deficit, it is possible that some projects in the pipeline that have not yet been approved could be cancelled. However, this will be moderated by concern over the negative impacts on the economy from such cancellations. Spending for national defense will be higher this year. And fortunately, federal spending not related to defense—mostly consisting of grants, both to the state for transportation (roads, harbors, railroad and ferry system) and sanitation projects and to non-profits for health facilities and housing—is not sensitive to the price of oil. Since 2013 the Alaska economy has underperformed compared with the national average in spite of the stimulus of high oil prices that led to record high levels of employment in the oil and gas and construction sectors. Job growth has been less than 1% annually and is forecast to be negative in 2016. State population has not increased in the last two years. This slowdown, combined with the heightened uncertainty about the future direction of the economy, brought on by the sudden fall in the oil price, will slow new private investment—particularly in the commercial and residential construction sectors as investors adopt a “wait and see” attitude, in regard to both the private economy and the ability of the state government to deal with the deficit. The decline in private construction spending this year is also partially due to the completion of a number of large utility and hospital projects. As in past years, some firms are reluctant to reveal their investment plans, because they don’t want to alert competitors; also, some have not completed their 2016 planning. Large projects often span two or more years, so estimating “cash on the street” in any year is always difficult because the construction “pipeline” never flows in a completely predictable fashion. Tracing the path of federal spending coming into Alaska without double counting is also a challenge, and because of the complexity of the state capital budget, it is always difficult to follow all the flows of state money into the economy. We are confident in the overall pattern of the forecast. However, as always, we can expect some surprises as the year progresses.
-

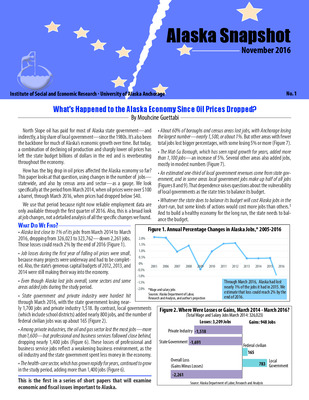
Alaska Snapshot: What's Happened to the Alaska Economy Since Oil Prices Dropped?
Mouhcine Guettabi
North Slope oil has paid for most of Alaska state government—and indirectly, a big share of local government—since the 1980s. It’s also been the backbone for much of Alaska’s economic growth over time. But today, a combination of declining oil production and sharply lower oil prices has left the state budget billions of dollars in the red and is reverberating throughout the economy. How has the big drop in oil prices affected the Alaska economy so far? This paper looks at that question, using changes in the number of jobs— statewide, and also by census area and sector—as a gauge. We look specifically at the period from March 2014, when oil prices were over $100 a barrel, through March 2016, when prices had dropped below $40. We use that period because right now reliable employment data are only available through the first quarter of 2016. Also, this is a broad look at job changes, not a detailed analysis of all the specific changes we found.
-

Overpaid or Underpaid? Public Employee Compensation in the State of Alaska
Mouhcine Guettabi and Matthew Berman
Are state workers better paid than their counterparts in private industry? That question is likely to come up more often, as the state deals with a huge budget shortfall. The answer is generally no, but there are exceptions. We analyzed the question in two ways, using different data sources for cash wages but the same assumptions about benefit levels.1 Using two sources helped us better answer the question, and each yielded the same broad conclusion: state workers are not on average paid more. That’s true, whether we consider just wages, or total compensation— wages plus benefits. But there are significant differences in pay and total compensation of public and private workers in individual occupations. We did this research for the Alaska Department of Administration (see back page). Below we summarize our findings, and inside report more details.
-

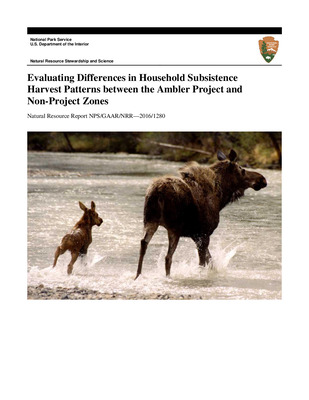
Evaluating Differences in Household Subsistence Harvest Patterns between the Ambler Project and Non-Project Zones
Mouhcine Guettabi, Joshua Greenberg, Joseph Little, and Kyle Joly
Western Alaska is one of largest inhabited, roadless areas in North America and, indeed, the world. Access, via a new road that would transverse Gates of the Arctic National Park and Preserve (GAAR), to a mining district in a vast roadless section of northwest Alaska has been proposed. Given the potential effects of the road on nearby communities, we analyzed how communities connected to the road system compare to their unconnected counterparts. Specifically, using zero inflated negative binomial models, we analyzed subsistence harvest data to understand factors that influence subsistence production at the household level. We found substantial difference in these factors between communities near the proposed road (project zone (PZ) communities and a comparable set of road accessible communities outside the region, and were affected by household characteristics such as the gender of the head of household, number of children, and income. Total subsistence production of project zone communities was 1.8 – 2.5 times greater than that of non-project zone communities. Communities with a higher percentage of Alaska Native residents had greater per capita subsistence harvests. Higher household income levels were associated with lower subsistence harvest levels. Roads can provide access for hunters from outside the region to traditional subsistence hunting grounds used by local residents that would not be very accessible if not for the road. Our proxy for competition (number of nonlocal moose hunters) indicates that resident moose harvest amounts are inversely related to the number of hunters in a particular area. If subsistence harvest patterns for project zone communities currently off the road changed to mirror existing non-project zone harvests due to the road, the financial cost would be USD $6,900 – 10,500 per household per year (assuming an $8/lb. ‘replacement’ cost for subsistence harvests). This represents about 33% of the median household income. Taken together, our results suggest that the proposed road should be expected to substantially impact subsistence production in communities that are not currently connected to the road system. The scale of our data did not allow for the comparison of the impacts of the different proposed routes but the impacts of different routes is likely minor in relation to the presence or absence of the proposed road
-

Short-Run Economic Impacts of Alaska Fiscal Options
Funnar Knapp, Mouhcne Guettabi, and Matthew Berman
-

Short-Run Economic Impacts of Alaska Fiscal Options
Gunnar Knapp, Matthew Berman, and Mouhcine Guettabi
Today Alaskans are talking about how to close the huge budget deficit the state government is facing, with the oil revenues it has depended on for decades now a small fraction of what they once were. Alaska has had budget deficits for several years, and it has made budget cuts—but it has mainly relied on billions of dollars in savings from the Constitutional Budget Reserve and other funds to cover the deficit. Those savings are dwindling, and the state needs to take measures to close the deficit. An important consideration is how various ways of reducing the deficit might affect Alaska’s economy. This study compares potential short-run economic effects of 11 options the state might take in the next few years to reduce the deficit and that are sustainable over the long term. We looked at economic effects of several types of spending cuts and taxes, as well as reducing the Permanent Fund dividend— the annual cash payment the state makes to all residents—and saving less of Permanent Fund earnings. We’re not advocating or opposing any option: our purpose is to estimate and compare the magnitude of the short-run economic effects of different ways of reducing the deficit. Broadly speaking: • Different ways of collecting money from Alaskans affect those with lower and higher incomes in significantly different ways. • Anything the state does to reduce the deficit will cost the economy jobs and money. But spending some of the Permanent Fund earnings the state currently saves would not have short-run economic effects. Saving less would, however, slow Permanent Fund growth and reduce future earnings. • Because the deficit is so big, the overall economic effects of closing the deficit will also be big.
-

Webnote 21. The Growing Number of Alaska Children in Foster Care, 2011-2015
Jessica Passini and Diwakar Vadapalli
-

The Growing Number of Alaska Children in Foster Care, 2011-2015
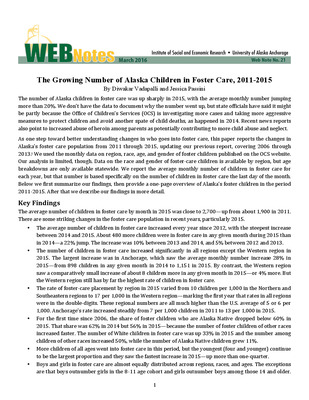
Diwakar Vadapalli and Jessica Passini
The number of Alaska children in foster care was up sharply in 2015, with the average monthly number jumping more than 20%. We don’t have the data to document why the number went up, but state officials have said it might be partly because the Office of Children’s Services (OCS) is investigating more cases and taking more aggressive measures to protect children and avoid another spate of child deaths, as happened in 2014. Recent news reports also point to increased abuse of heroin among parents as potentially contributing to more child abuse and neglect.
-

Benefits and Costs to Rural Alaska Households from a Carbon Fee and Dividend Program
Steve Colt
This paper analyzes the benefits and costs of a carbon fee‐and‐dividend (CFD) policy to individual rural Alaska households. The three study area regions are the Bethel Census Area, the Wade Hampton Census Area, and the Northwest Arctic Borough. These three regions have the state’s highest fuel prices and very cold climates. The CFD policy consists of two elements. The first is a fee of $15 per metric ton of CO2 beginning in 2016 and increasing by $10 per ton in each subsequent year. The second is the complete return of all fees to households in the form of dividends, which are estimated to equal $300 for each adult plus $150 for each child (up to two). The annual dividends would increase in future years commensurate with the total amount of fees.
-

Benefits and Costs to Rural Alaska Households from a Carbon Fee and Dividend Program - Final Report
Steve Colt
This paper analyzes the benefits and costs of a carbon fee‐and‐dividend (CFD) policy to individual rural Alaska households. The three study area regions are the Bethel Census Area, the Kusilvak Census Area, and the Northwest Arctic Borough. These three regions have the state’s highest fuel prices and very cold climates. The CFD policy consists of two elements. The first is a fee of $15 per metric ton of CO2 beginning in 2016 and increasing by $10 per ton in each subsequent year. The second is the complete return of all fees to households in the form of dividends, which are estimated to equal $300 for each adult plus $150 for each child (up to two). The annual dividends would increase in future years commensurate with the nationwide total amount of fees. Baseline conditions. The study area has a total population of about 32,000 people, many of whom live in large households with low cash income. Fuel prices averaged $6.62 per gallon in January 2015.
Printing is not supported at the primary Gallery Thumbnail page. Please first navigate to a specific Image before printing.

