
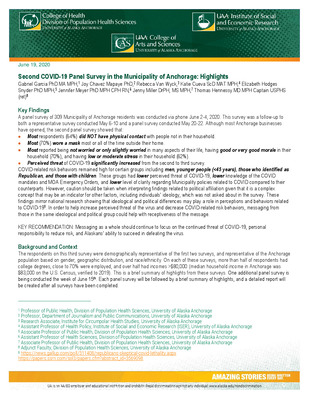
-

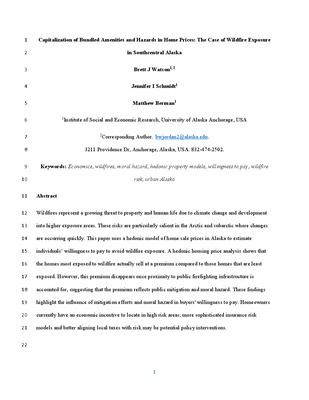
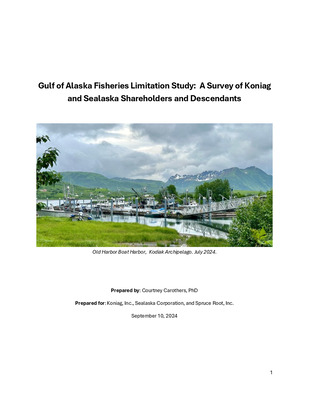
The Impact of Anchorage's 2000 and 2007 Smoke-Free Policies on Select Restaurants and Bars
Mouhcine Guettabi, Rosyland Frazier, Katie Cueva, John Wheeler, and Peggy Nye
The American Lung Association in Alaska (ALAA) asked the Institute of Social and Economic Research (ISER) to investigate the impact of the Anchorage 2000 and 2007 Clean Indoor Air (CIA) municipal ordinances on selected restaurants and bars. As previous U.S. studies have been conducted that speak to the economic and health impacts of CIA laws, ALAA also requested that ISER synthesize results of these existing studies and conduct a survey on restaurant and bar representatives’ perceptions of the impact of the ordinances.
-

Alaska Employer Health-Care Benefits: A Survey of Alaska Employers
Mouhcine Guettabi, Rosyland Frazier, and Gunnar Knapp
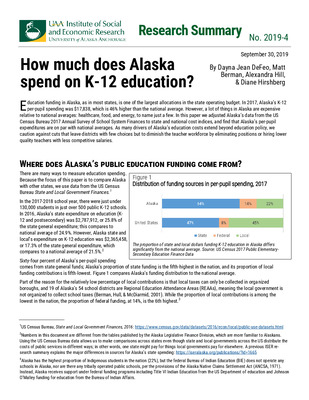
The majority of Alaskans and Americans who have health insurance coverage get it through an employer—either their own employer or the employer of a family member. The U.S. Census Bureau estimates that 55.4% of all Alaskans got health insurance through an employer in 2012—and 68.4% of those with health insurance got it through an employer. But those census estimates also suggest that the share of Alaskans and other Americans who get health insurance from their employers has been gradually declining (Figures I-1a and I-1b). Figure I-1a. Figure I-1b. Source: U.S. Census Bureau, Health Insurance Historical Tables-HIB Series, Table HIB-4: Health Insurance Coverage Status and Type of Coverage by State--All Persons: 1999 to 2012, http://www.census.gov/hhes/www/hlthins/data/historical/HIB_tables.html. Because employer-sponsored insurance is so important to Alaskans, the Alaska Health Care Commission sponsored a survey of businesses, local governments, and school districts statewide, asking whether they offer employees insurance or other health benefits, which employees are eligible, and what types of plans and rates they offer.
-

Snapshot of Employer-Sponsored Health Insurance in Alaska
Mouhcine Guettabi, Rosyland Frazier, and Gunnar Knapp
-

UAA Graduates: How Many Stay and Work in Alaska?
Alexandra Hill, Gunnar Knapp, and Blake Steenhoven
More and more people have been graduating from the University of Alaska Anchorage in the past decade. Do they stay in Alaska? What kinds of jobs do they have? How much do they earn? It turns out that most of them stay in Alaska for at least five years after they graduate, they work throughout the economy, and by five years after they graduate their average earnings double. Around one-quarter do leave within a few years. But Alaska’s population on the whole is transient, and it looks as if UAA graduates are no more likely than other Alaskans to leave the state. And the limited evidence for those who graduated in the most recent years suggests they may be staying on in higher numbers. These are among the findings of an analysis ISER and UAA’s Office of Institutional Research did for university leaders, who wanted to know more about UAA graduates working in Alaska. It’s based on patterns among nearly 9,000 people who got UAA certificates or degrees from 2003 through 2007. We asked researchers at the Alaska Department of Labor and Workforce Development to compare data on graduates with data on employment and residence, in the years since they graduated. The department’s employment data cover only people working for businesses or state and local governments. There is no comparable data on federal workers or self-employed people. So when we describe graduates working in Alaska, the figures don’t include those who work for the federal government or are self-employed.
-

Alaska Energy Data Gateway Provides New Services
Ben Saylor and Ginny Fay
This short news release outlines the contributors and content of the Alaska Energy Data Gateway website.
-

Attitudes towards land use and development in the Mat-Su: Empirical evidence on economic values of ecosystem services
Tobias Schwörer
In communities that largely depend on the extraction of natural resources, attitudes towards conservation and development may seem at odds or particularly rigid. With an unprecedented wealth of natural capital, a growing mining sector, strong oil and gas industry, and a politically conservative population, Alaska serves as a case study to measure such attitudes. This research was motivated by a lack of primary ecosystem service valuation studies in Alaska that could be used to assess the public’s perceived value of ecosystem services in order to guide future land use decisions and incentivize land use decisions that minimize negative externalities. A choice experiment was conducted with 224 households in the Matanuska-Susitna Borough, the fastest growing region in Alaska and one of the fastest growing regions in the U.S. Rapid development with few restrictions has led to changes for local ecosystems particularly important to salmon, negative effects on access related to recreation and tourism, and caused conversion of valuable farmland. Study results show that attitudes and values vary regarding future land use and economic development efforts. On average, policy action to improve conditions for local salmon stocks are most valuable to local residents followed by protecting farm and ranch lands as well as public access to recreation sites. Conversely, residents show negative preferences towards rapid population growth and developing local mining, oil and gas, and timber resources but support developing a professional and technical services sector. The quantified welfare changes related to different development scenarios show that focusing on conserving valuable ecosystem services is in the public’s best interest.
-

The Mat-Su Borough in 2040: What Would Residents Like to See?
Tobias Schwörer
Many residents of the Mat-Su Borough were attracted to the area by its rural character: low-density population, salmon streams, opportunities for recreation and hunting in undeveloped areas, and food produced by local farmers. With rapid population growth, these characteristics have been changing, and they will likely continue to change without policies to maintain or restore them. But residents can influence such change, by letting policymakers know what they value. What do Mat-Su residents want their area to look like in 2040? What value do they place on rural character and recreation opportunities? What would they be willing to pay to maintain or restore those characteristics? These are important questions for people in the borough, which borders Anchorage on the north. It has for decades been the fastest-growing area in Alaska, with a current population five times what it was in 1980.
-

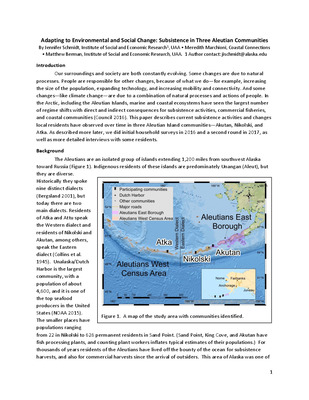
Monitoring the Status of Alaska Fishing Communities, 1980-2010
Suresh Andrew Sethi, William Riggs, and Gunnar Knapp
Commercial fishing provides social and economic benefits for hundreds of communities across Alaska, with dozens of species being harvested commercially. The state's fisheries are complex, with the species mix, vessels and gear, environmental conditions, and socioeconomic circumstances varying widely from one part of the state to another. And while the majority of Alaska's fisheries continue to be successfully managed for sustainable harvests, fishing communities face a number of challenges, including changing market conditions, volatile catches and stock dynamics, changes in fishery regulations, redistribution of access rights, and climate change.
-

Trends in Age, Gender, and Ethnicity Among Children in Foster Care in Alaska
Diwakar Vadapalli, Virgene Hanna, and Jessica Passini
In Alaska, as in every other state, people who suspect children are being abused or neglected can contact the designated child protection agency. In Alaska, that agency is the Office of Children Services (OCS). It is responsible for investigating all reported incidents and determining the level of risk to the health, safety, and welfare of children. In a number of instances, children will be removed from their families and homes due to unsafe conditions, and they are often placed in foster care. 1 Being taken away from their families is of course traumatizing for children. The number of American children in foster care at any time, and the length of time they spend in foster care, has been closely watched over the last several decades. Several changes in policy and practice were introduced in the last 20 years, at national and state levels, to reduce both the number of children in foster care and the length of time they stay in foster care. These changes caused some dramatic trends at the national level: the number of children in foster care in the U.S. declined by almost a quarter (23.7%) between 2002 and 2012, with the decline being most pronounced among AfricanAmerican children (47.1%). As of 2012, African-American children made up 26% of all children in foster care nationwide, down from 37% a decade earlier. But during the same period, the proportion of children in foster care classified as belonging to two or more races almost doubled. And American Indian/Alaska Native children are the highest represented ethnic group among foster children—13 of every 1,000 American Indian/Alaska Native children in the U.S. were in foster care in 2012. In contrast, no such dramatic changes happened in Alaska in recent years. This paper reports on foster children in Alaska by age, gender, race, and region over the period 2006-2013. This information is important for state policymakers working to better protect abused and neglected children. At the end of the paper we discuss questions the data raise and describe additional data needed to better help children in foster care in Alaska. We compiled data for this analysis from monthly reports of key indicators on foster children in the state. OCS publishes monthly data on select indicators (Alaska State Statutes 2011, Monthly reports concerning children, AK. Stat. § 47.05.100), in PDF format on its website (http://dhss.alaska.gov/ocs/Pages/statistics/default.aspx). Data presented here are snapshots in time and do not follow unique children over time.
-

Contribution of Land Conservation and Freshwater Resources to Residential Property Values in the Matanuska-Susitna Borough
Jeffrey Armagost and Matthew Berman
-

Contribution of Land Conservation and Freshwater Resources to Residential Property Values in the Matanuska-Susitna Borough
Matthew Berman and Jeffrey Armagost
Growing interest in quantifying values of ecosystem services has generated numerous studies attempting to measure the contribution of neighborhood environmental amenities to urban and suburban property values. Proximity to freshwater resources -- lakes and streams -- has also figured prominently in many of these studies. Alaska’s Matanuska-Susitna (Mat-Su) Borough, analogous to a county under state law, is a large and rapidly urbanizing local government jurisdiction adjacent to Anchorage, the state’s largest metropolitan area. As the population of the borough grows, and more land becomes subdivided and developed, an important question arises regarding the contribution of remaining undeveloped land and natural amenities to the economy of the borough. Visitors who are attracted to the scenery and recreation opportunities of the borough capture some of that value, and contribute to the borough economy through local purchases of goods and services. Private owners of borough real estate, who are willing to pay more for property located close to natural areas and recreation sites, also appropriate a portion of the value, however. This study focuses on this latter component of value of ecosystem services. It provides estimates of the enhanced value of private residential property and undeveloped land in the Mat-Su borough created by local protected open space and outdoor recreation opportunities. After briefly describing the Mat-Su Borough region, we summarize the valuation methods and the data available for the study. Then we present statistical results, followed by a discussion of the implications of the findings for valuing ecosystem services in the Borough. We conclude with suggestions for future research to improve the estimates.
-

Susitna-Watana Cost of Power Analysis
Steve Colt
This paper provides a simple analysis of the cost of the proposed Susitna-Watana hydroelectric project from a ratepayer perspective, using data current as of June 2013. The Susitna Case 1 assumptions include a capital cost of 5.19 billion 2012 dollars, 100% debt financing at 5.0%, and an on-line date of 2024. Under these assumptions plus others described below, the production cost of Susitna power in 2024 would be 13 cents per kilowatt-hour (kWh) and the cost at a Railbelt customer’s meter would be about 18 cents per kWh.1 By comparison, if natural gas is available to electric utilities in year 2024 at a price of about $9.50 per million btu, and ignoring potential carbon taxes, then the production cost and retail cost of power from a new combined cycle gas turbine going online in 2024 would be about 11 cents and 16 cents per kWh, respectively.
-

The Alaska Village Energy Model
Steve Colt
We have constructed a simple but comprehensive village energy use model that includes space heating and transportation fuel use as well as electricity. Because people in isolated remote northern communities pay about 2/3 of their overall energy bills for heat and transportation (WH Pacific et al. 2012), knowledge of overall energy demand by major end use is important when considering energy systems that can make the best use of efficiency and renewables as resources to offset costly fossil fuels. Previous work (Devine & Baring-Gould 2004) provides community planners and policy makers with a good tool for estimating community electricity demand. This paper builds on that work with an integrated model that can be used to estimate overall village energy usage based on a relatively small number of socioeconomic characteristics, such as population; number of residential, commercial and public facilities; housing and building stock characteristics; and transportation patterns and equipment types. The Alaska Village Energy Model (AVEM) model uses the best available primary data from recent collection efforts, and can easily incorporate new data that may become available."
-

Potential Improvements to National Park Service Visitor Surveys and Money Generation Modeling in Alaska
Steve Colt, Ginny Fay, and Virgene Hanna
This study presents options for improving the use of the Money Generation Model in National Park Service (NPS) land units in Alaska. The Money Generation Model (MGM) is used nationwide to model economic impacts of visitation to public lands, including National Park Units. This analysis identifies potential improvements to the application of the MGM model and visitor survey processes for use in Alaska. Improvements include changes to visitor intercept methods to improve statistical reliability of the sampling process and a more representative sample, changes in the survey instrument to more accurately reflect Alaska visitor travel and expenditure patterns, and better identification of the economic sphere of influence of Alaska national park units.
-

Potential Improvements to National Park Service Visitor Surveys and Money Generation Modeling in Alaska
steve Colt, Virgine Hanna, and Ginny Fay
-

Alaska Fuel Price Projections 2013-2035
Ginny Fay, Alejandra Villalobos Meléndez, Sohrab Pathan, and Jeffrey Armagost
The Alaska Fuel Price Projections are developed for the Alaska Energy Authority (AEA) for the purpose of estimating the potential benefits and costs of renewable energy projects. Project developers submit applications to AEA for grants awarded under the Alaska Renewable Energy Fund (REF) program process. These fuel price projections are used to evaluate the economic feasibility of project applications; economic feasibility is only one of many factors of the project evaluation process. In this report we present the methodology for the seventh fuel prices projection. In addition to their use for the REF review, the Institute of Social and Economic Research (ISER), University of Alaska Anchorage (UAA) uses the projections for other economic research and energy project evaluations. Economists at ISER have completed six previous Alaska Fuel Price Projections since 2008 (all available at: http://www.iser.uaa.alaska.edu/). The fuel price projections fulfill an important need for price information and are used by many stakeholders in addition to AEA. As a result of their broad use among the public, we expanded what used to be cursory notes on methodology. Our intent is to provide more detailed information to the report’s readers and users of the fuel price projections.
-

Alaska Energy Statistics 1960-2011 Final Report
Ginny Fay, Alejandra Villalobos Meléndez, and Corinna West
This twenty-sixth edition of the Alaska Energy Statistics reconciles energy data from public sources and makes that data more easily available to the public and stakeholders. It primarily presents 2011 data on electricity produced by certified utilities in Alaska. It includes a brief introduction, highlights, and summary data tables. The first major section describes basic statistical indicators for Alaska utilities, and the second discusses renewable energy in Alaska. After that we look more broadly at the big picture of energy in Alaska, describing production and consumption of various energy sources. A series of appendixes defines terms, lists references, and describes data sources. This report presents data for the state and for the 11 Alaska Energy Authority energy regions. In an accompanying workbook, we also present data by U.S. census areas, Alaska Native corporation regions, and regions used in earlier Alaska Electric Energy Statistics reports.8 Unlike the preliminary version of this report, issued in fall 2012, this final report includes installed capacity data tables for 2011, as well as additional chapters on renewable energy and other Alaska energy information.
-

Analysis of Alaska Transportation Sectors to Assess Energy Use and Impacts of Price Shocks and Climate Change Legislation
Ginny Fay, Tobias Schwörer, Mouhcine Guettabi, and Jeffrey Armagost
We analyzed the use of energy by Alaska’s transportation sectors to assess the impact of sudden fuel prices changes. We conducted three types of analysis: 1) Development of broad energy use statistics for each transportation sector, including total annual energy and fuel use, carbon emissions, fuel use per ton-mile and passenger-mile, and cost of fuel per ton-mile and passenger-mile. 2) Economic input-output analysis of air, rail, truck, and water transportation sectors. 3) Adjustment of input-output modeling to reflect sudden fuel price changes to estimate the potential impact on industry output and employment. Alaska air transportation used approximately 1.9 billion gallons of fuel annually; 961 million gallons were used for intra-state and exiting Alaska flights. Water transportation used 101.8 million gallons annually, approximately 84.3 million gallons for intra-state and exiting segments. Railroad and truck transportation used 5.1 and 8.8 million gallons annually, respectively. Simulated fuel price increases resulted in an estimated $456.8 million in value-added losses to the Alaska economy through the increase in cost of transportation services, as well as an equivalent loss in income to Alaska household of $26.8 million. A carbon emissions tax would have the greatest impact on the cost of air transportation services followed by water, trucking and rail.
-

How Do Higher Fuel Prices Affect Alaska's Transportation System and Economy?
Ginny Fay, Tobias Schwörer, Mouhcine Guettabi, and Jeffrey Armagost
-

2011 Denali National Park and Preserve Visit Characteristics
Peter Fix, Andrew Ackerman, and Ginny Fay
-

Cancer Control Continuum Gap Analysis: Inventory of Current Policy and Environmental Strategies
Rosyland Frazier, Mouhcine Guettabi, and Katie Cueva
"Comprehensive cancer control (CCC) is a process through which communities and partner organizations pool resources to reduce the burden of cancer. These combined efforts help to reduce cancer risk, find cancers earlier, improve treatments, and increase the number of people who survive cancer. ”This analysis has explored both current policies that have been enacted in Alaska at the state and federal level, and those that are acknowledged at a national level. The gap analysis is designed to inform the State DHSS as it takes steps to develop a policy agenda for comprehensive cancer control that aims to; reduce the risk of developing cancer, identify cancer earlier, improve cancer treatment, and increase the number of cancer survivors."
-

Preventive Screenings Gap Analysis
Rosyland Frazier, Mouhcine Guettabi, John Wheeler, and Katie Cueva
-

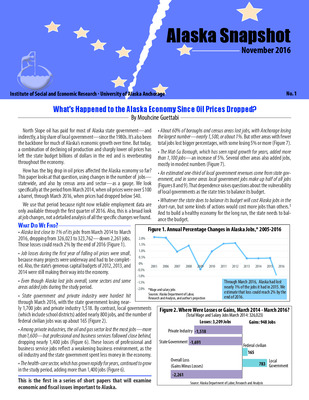
Maximum Sustainable Yield: FY 2014 Update
Oliver Scott Goldsmith
In fiscal year 2014, Alaska’s state government can afford to spend about $5.5 billion. That’s an estimate of the level of Unrestricted General Fund spending the state can sustain over the long run, based on the current petroleum nest egg of about $149 billion—a combination of state financial assets (the Permanent Fund and cash reserves) and the value of petroleum still in the ground. The size of that nest egg fluctuates, depending on the state’s forecast of petroleum revenues, earnings on investments, and other factors. This Web Note presents the latest in a series of estimates of the maximum amount the state can spend and still stay on a sustainable budget path.
-

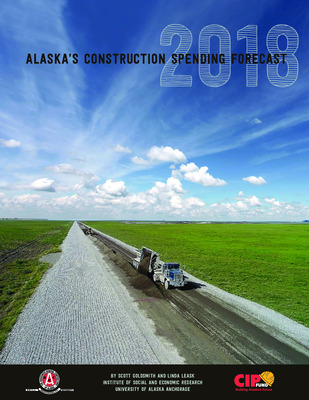
2013 Alaska's Construction Spending Forecast
Oliver Scott Goldsmith and Mouhcine Guettabi
The Construction Industry Progress Fund (CIPF) and the Associated General Contractors (AGC) of Alaska are pleased to have produced another edition of “Alaska’s Construction Spending Forecast.” Compiled and written by Scott Goldsmith and Mouhcine Guettabi of the University of Alaska’s Institute of Social and Economic Research (ISER), the “Forecast” reviews construction activity, projects and spending by both the private and public sectors for the year ahead. The construction trade is Alaska’s third largest industry, paying the second highest wages, employing nearly 16,000 workers with a payroll over $1 billion. It accounts for 20 percent of Alaska’s total economy and currently contributes approximately $8 billion to the state’s economy. The construction industry reflects the pulse of the economy. When it is vigorous, so is the state’s economy. Both CIPF and AGC are proud to make this publication available annually and hope it provides useful information for you. AGC is a non-profit, full service construction association for commercial and industrial contractors, subcontractors and associates. CIPF is organized to advance the interests of the construction industry throughout the state of Alaska through a management and labor partnership.
Printing is not supported at the primary Gallery Thumbnail page. Please first navigate to a specific Image before printing.
