
-

Policy Implications of Freestanding Emergency Departments
Rosyland Frazier and Mouhcine Guettabi
Policymakers have a responsibility to look at both the short- and long-term implications of their decisions. The state’s current fiscal situation, coupled with rising health-care costs makes “budget neutrality” highly desirable in decision-making. In spite of efforts to bend the cost curve, health expenditures have grown inexorably in Alaska. As of 2009 our health expenditures per capita were the second highest in the nation. This means that the state spends a larger portion of its budget on health costs, employers allocate more of employees’ compensation to health premiums, and households spend more of their disposable income on out-of- pocket costs, premiums, and co-pays. The evidence we provide in this analysis consistently shows that freestanding emergency departments charge higher prices for services that are available for considerably less in traditional settings. Allowing freestanding emergency departments to enter the Alaska market goes against the many efforts being undertaken to contain health-care costs. Markets forces explain a significant portion of the high health-care prices charged in Alaska, but in this case the state has an opportunity to use its regulatory authority to help prevent even higher prices in the future. Putting costs aside, in considering emergency services one needs to rationalize the hospital and clinical capacity across a region and the needs of the population. In the Alaska health-care system there are problems with coordinating the delivery of care. Freestanding emergency departments pose the risk of exacerbating that lack of coordination, if people use them in lieu of seeing their primary physicians—which can disrupt the continuum of care and potentially hurt outcomes for patients.
-

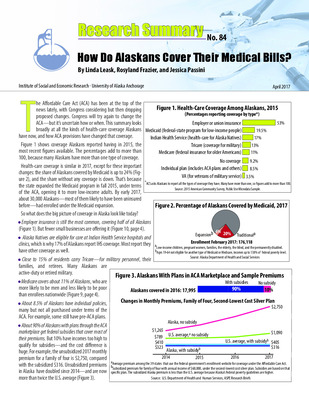
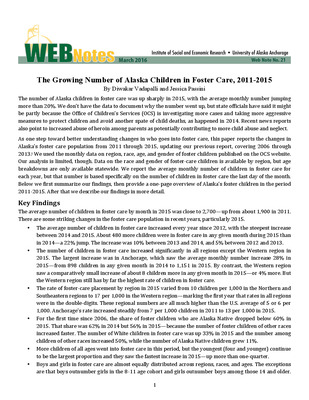
Kids Count Alaska 2013-2014
Rosyland Frazier, John Wheeler, Kent Spiers, Daniel Kirby, and Meg Mielke
Kids Count Alaska is part of a nationwide program, sponsored by the Annie E. Casey Foundation, to collect and publicize information about children’s health, safety, education, and economic status. We gather information from many sources and present it in one place, to give Alaskans and others a broad picture of how well the state’s children are doing—and provide parents, policymakers, and others with information they need to improve life for children and families. Our goals are: • Distributing information about the status of Alaska’s children • Creating an informed public, motivated to help children • Comparing the status of children in Alaska with that of children nationwide, but also presenting additional indicators relevant for Alaska
-

Maximum Sustainable Yield: FY 2016 Update and Model
Oliver Scott Goldsmith
Plummeting oil prices in 2014 and projected huge budget deficits have focused more attention on a question we began examining several years ago: how much can Alaska’s state government afford to spend, without risking the petroleum assets that supply most of its income? Sustainable annual General Fund spending is currently an estimated $4.5 billion. That’s how much the state could spend for general expenses this year and every year, long into the future, without depleting Alaska’s nest egg: state petroleum assets. It’s less than last year’s estimate of $5 billion, partly because expected oil revenues are smaller. The state should begin moving toward sustainable spending now. At this time we don’t know how much the state will spend this year. State officials are re-thinking planned spending, given the drop in oil revenues. Budget cuts will affect the economy, which relies heavily on state money—so the cuts should be gradual rather than precipitous. This paper introduces an interactive model to help people understand the fiscal challenges Alaska faces (see page 5). Users can download it from ISER’s website and investigate for themselves the implications of different assumptions about state revenues and fiscal policies Alaska’s petroleum nest egg is currently an estimated $135 billion—$66 billion of money in the bank and $69 billion of expected future petroleum revenues from various sources. As market conditions change, the size of the nest egg will continue to change—it has fallen in each of the four years we’ve been estimating its size. So the sustainable spending level changes somewhat as well, but it provides a reasonable guideline for building the budget.
-

The Path to a Fiscal Solution: Use Earnings from All Our Assets
Oliver Scott Goldsmith
Thanks to a combination of good decisions and a little luck, today Governor Hammond’s vision has become a reality. More than $60 billion in financial accounts now generates more income for the state government than petroleum production. Yet we continue to rely mostly on current petroleum revenues to pay for public services—and as oil production declines, “sliding down the falling Prudhoe Bay revenue curve” is proving to be a formula for fiscal and economic disaster. In fiscal year 2016, General Fund revenues are expected to be only about $2.2 billion. That will leave an apparent “deficit” of about $3.3 billion, based on spending of $5.5 billion. But the state doesn’t have to face such a huge shortfall. There is a straightforward solution that Jay Hammond foresaw: using both current revenues and earnings from the state’s portfolio of assets (financial accounts and future petroleum revenues) to pay for public services.
-

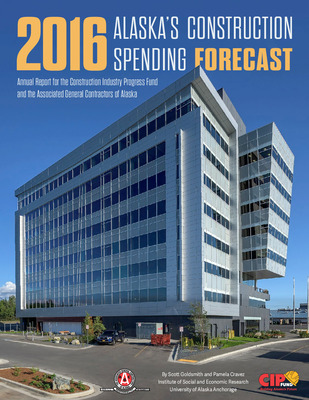
2015 Alaska's Construction Spending Forecast
Oliver Scott Goldsmith and Pamela Cravez
OVERVIEW The total value of construction spending “on the street” in Alaska in 2015 will be $8.5 billion, down 3% from 2014.1,2,3 Wage and salary employment in the construction industry, which increased an estimated 6 percent last year, to about 17,600, will decline slightly in 2015.4 Oil and gas sector spending will fall 2% to $3.8 billion from its record level of $3.9 billion last year. Other spending will be $4.7 billion, a decline from $4.9 billion last year. Private spending, excluding oil and gas, will be about $1.7 billion, down from $2.0 billion last year—while public spending will increase from $2.9 to $3.0 billion. Construction spending in Alaska in 2015 is expected to be strong in spite of the drop in the price of oil from more than $100 per barrel in the summer of 2014 to between $45 and $50 today. However, the longer the price stays low, the greater the risk that some projects will be cancelled or postponed. It is impossible to predict what will happen to the oil price, because world supply has outstripped demand. The price will stabilize, and perhaps begin to increase, only when the low price stimulates more demand and eliminates high cost production, a process that could take more than a year. A further complication is the unpredictability of the role of OPEC in determining oil supply. In particular Saudi Arabia, the largest producer, could decide to restrict supply for political or strategic reasons. Because of the drop in the price of oil, the state is facing a general fund budget deficit of about $3 billion for the current fiscal year (FY2015) and is projected to have a similar deficit in FY2016 (which begins July 1 of this year). However, this will not have a large negative impact on state government construction spending this year for several reasons.
-

Alaska Veterans Needs Assessment
Mouhcine Guettabi and Rosyland Frazier
The Institute of Social of Economic Research conducted a needs assessment of Alaska Veterans starting in the spring of 2014. Our goal was to identify and measure areas for improvement in providing services and determining the methods to achieve improvement. Our approach consisted of three methods: ‐ Survey of Alaska veterans using a list of 2,950 veterans who have requested veteran designation on their driver’s license. ‐ Focus groups: one consisting of women and one of disabled veterans. ‐ Key informant interviews with individuals responsible for helping veterans navigate the benefits available to them. Our findings are far ranging and details can be found in the report below. One of the most important lessons was the difference in needs across age groups. Younger veterans were concerned about education and employment while their older counterparts valued health care and navigating the application process. Consistent with these differences, the focus groups made it clear that targeted reminders that take into account the veteran’s life stage may be more effective. As things stand, the amount of information one is exposed to at separation can be overwhelming and intimidating. Awareness and use of federal benefits was high for health care, housing, and education benefits. Employment services were less utilized but most of our respondents were aware of their existence (Table 19). Across the board, lack of knowledge/awareness of specific benefits does not seem to be systemic. The three most claimed benefits were Health Care, Disability Compensation, Home Loans, and Education and Training. At the state level, the most commonly claimed benefits by the survey respondents are the veteran driver’s license, veterans license plates, hunting and fishing licenses, property exemption, education benefits, and veterans housing and residential loans. Of note is that only 9% claimed Veteran employment services and awareness about state benefits seems to be more of an issue than in the federal case. A third of our respondents had a disability rating of 50% or higher. Disability payments are very important across the board but seem to be essential for veterans with higher disability ratings. These payments were also more important to younger veterans who potentially have had less time to accumulate savings over their lifetime. Health care use is very much associated with age as older respondents were more likely to have applied for Health Care Services. Additionally, disability rating is also associated with frequency of health care use and utilization of VA services. Thirty percent of our respondents think they will use VA as their primary source of healthcare.Younger veterans are considerably more likely to use education benefits. The majority of our respondents used education benefits after active duty. However, more than ten percent have used education benefits both before and after and another seven percent used them only during active service. When asked about living arrangements in case a veteran could not care for themselves, it was clear that proximity to friends and family was paramount. Anchorage was chosen as the location most of them would prefer.
-

After Broadband: A Study of Organizational Use of Broadband in Southwest Alaska
Heather E. Hudson, Suzanne Sharp, and Alexandra Hill
The purpose of this research was to gain a preliminary understanding of how organizations including large and small businesses, Native corporations and organizations, and local and regional governments are using broadband that is now available in much of southwest Alaska. To learn about community access to broadband, interviews were also conducted with library and school staff in communities where broadband had been installed under the OWL (Online with Libraries) program. Further, the study identifies research from other sources that could help to predict what socio-economic impacts the availability and adoption of broadband may have in rural Alaska. Financial institutions use online connections for teller services and credit and debit card processing, and stated that more people in rural communities now have debit cards that they can use for online purchases and bill paying. Large retailers use online services for payroll, for pointof-sale (POS) transactions, and online ordering. Seafood processors rely heavily on connectivity with their head offices (generally in the lower 48) for administrative services including payroll, accounting, shipping and receiving, purchasing, and ERP (enterprise resource planning), and access data base software to track fish tickets. Seafood processors also provide Internet access for their employees, most of whom are seasonal and from other states or countries. Tourism businesses use broadband for online reservation systems and for guests, who increasingly demand connectivity even for remote vacations. Village corporations and tribal councils use online services to help their residents obtain hunting and fishing licenses and fishing permits, to learn about funding opportunities, and to file reports on grants. Local Governments connect online for interoffice communications and for payroll and other administrative functions. Other online applications and services include providing remote desktop access from other agency sites, use of online tools for land management and mapping, training including webinars for workforce development, and providing access to social services for clients. An economic development organization sends newsletters to communities electronically and packets of documents to its board members rather than relying on fax or courier. Websites are important for tourism-related businesses to advertise and promote their businesses and for nonprofits and local governments to provide information about their services. 5 Broadband now plays many roles in rural education. Most students are required to use the Internet for class assignments. High school students can connect to classes in advanced subjects in other communities, and may complete online courses for college credit. Libraries remain important locations for community access, with residents going online to connect with friends on Facebook, as well as to download content for e-books, file income tax, and apply for jobs and government benefits. School and library Wi-Fi provides access inside and near the buildings for residents with smartphones. Despite enthusiasm for broadband and the adoption of many broadband-based applications and services, most organizations interviewed identified problems with broadband, particularly with the pricing, stating that the terrestrial broadband network is too costly for them to take full advantage of online services and applications. While the scope of this study was too limited to estimate long-term benefits, it found that broadband is highly valued and increasingly important to businesses and nonprofit organizations and local governments in southwest Alaska. Broadband helps businesses to be more efficient in their operations and to extend their reach to new customers and suppliers. It also helps to improve the effectiveness of public sector services such as those provided by borough and city governments and extends access to education and training. Broadband is also likely to be an important component of strategies to develop ecotourism and other ecosystem services.
-

Fiscal Effects of Commercial Fishing, Mining and Tourism
Bob Loeffler and Steve Colt
This report summarizes the fiscal effects of the commercial fishing, mining, and tourism industries on Alaska’s state government. The report calculates state revenue collected from each industry and compares it to the state’s expenditures for that industry. What revenue does the State of Alaska receive from commercial fishing? From the mining industry? From tourism? What does the state pay out to manage each resource? While the comparison between the state’s revenue and expenditures is useful information, this report is not an economic benefit-cost analysis.
-

Repeat Maltreatment in Alaska: Assessment and Exploration of Alternative Measures
Jessica Passini and Diwakar Vadapalli
-

Measuring and Correcting Response Heaping Arising From the Use of Prototypes
Jennifer Schmidt, Jay Beaman, Jerry Vaske, and Tzung-Cheng Huan
Imprecision in respondent recall can cause response heaping in frequency data for particular values (e.g., 5, 10, 15). In human dimensions research, heaping can occur for variables such as days of participation (e.g., hunting, fishing), animals/fish harvested, or money spent on licenses. Distributions with heaps can bias population estimates because the means and totals can be inflated or deflated. Because bias can result in poor management decisions, determining if the bias is large enough to matter is important. This note introduces the logic and flow of a deheaping program that estimates bias in means and totals when people use approximate responses (i.e., prototypes). The program can make estimates even when spikes occur due to bag limits. The program is available online, and smooths heaps at multiples of 5 (numbers ending in 5 and 0) and 7 (e.g., 7, 14, 21), and produces standard deviations in estimates.
-

Assessment of Services Available for Children Exposed to Intimate Partner Violence in Anchorage, Alaska
Diwakar Vadapalli
The Cook Inlet Tribal Council (CITC) plans to expand services provided under its Flourishing Child initiative, and requested an assessment of service needs for children in the Anchorage area that are exposed to intimate partner violence (IPV). Specifically, CITC wishes to know if the proposed expansion of Flourishing Child services will satisfy an unmet need in the community. This assessment includes a brief introduction and review of related concepts, and an assessment of services available within the Municipality of Anchorage.
-

Repeat Maltreatment in Alaska: Assessment and Exploration of Alternative Measures
Diwakar Vadapalli and Jessica Passini
Most deaths and serious injuries among children who are abused or neglected are preceded by multiple reported instances of maltreatment. The Office of Children Services (OCS), Alaska’s child protection agency, is very concerned about repeat maltreatment. It’s extremely damaging to children and demoralizing to everyone who tries to help prevent it. Over the last several years, Alaska has consistently had among the highest rates in the country of repeat child maltreatment, as reported by the Children’s Bureau of the U.S. Department of Health and Human Services. Those federal figures measure the percentage of children who were the victims of at least two substantiated reports—that is, confirmed reports—of maltreatment within six months. In 2009, nearly 10% of children who were the subjects of investigation by OCS were reported as suffering repeat maltreatment, compared with less than 6% nationwide. By 2013, the share in Alaska was at nearly 13%, compared with a national rate of less than 5.5% (Figure S-1). But even those grim federal statistics don’t provide a complete picture of repeat child maltreatment in Alaska. Many analysts believe that not all cases where maltreatment may have occurred are substantiated, and that maltreatment of a child may be reported a number of times, over a longer period, before it is substantiated. Also, for various reasons, many reports of maltreatment are not investigated at all, in Alaska and other states, and only a small share of those that are investigated are substantiated. For example, in Alaska in 2013, 42% of reports in an average month were not investigated, and only 12% of reports were substantiated
-

Comparing Alaska's Oil Production Taxes: Incentives and Assumptions
Matthew Berman
In a recent analysis comparing the current oil production tax, More Alaska Production Act (MAPA, also known as SB 21) to the tax it replaced, Alaska’s Clear and Equitable Share (ACES), Scott Goldsmith, professor emeritus of economics at ISER, found that MAPA would produce higher revenues in the future, if changing to MAPA causes producers to make investments that lead to more production than would have occurred under ACES.2 Professor Goldsmith did not advocate for either tax, but projected effects of each under a range of different future oil prices, production rates, and costs. He noted that comparative revenues are highly sensitive to future costs and oil prices. Oil prices are notoriously difficult to forecast. Future North Slope oil production, as well as lease costs that can be deducted from producers’ tax liabilities under both ACES and MAPA, are also highly uncertain. Proponents of either MAPA or ACES appear to make assumptions about prices, production, and costs that support their arguments. Given the inherent uncertainty about oil prices, new production, and expenditures for capital and operating costs, what assumptions would be most reasonable to make for assessing outcomes of the tax regimes? This note critically examines the relevant assumptions for projecting tax outcomes, and explores how the different taxes compare under a set of assumptions that seem most reasonable, given our best current information. The comparisons address not only the amount of revenue the state would collect, but also how the taxes differently share risk between the industry and the state, and administrative issues affecting the nature of the relationship between the oil industry and state government. The analysis also places the debate about MAPA vs. ACES in the longer term context of Alaska oil production taxes, comparing MAPA and ACES to the original petroleum profits tax (PPT) that preceded ACES, and to the old severance tax PPT replaced.
-

Fiscal Impacts of Alternative Land Use Scenarios for the Matanuska-Susitna Borough, Alaska
Steve Colt
This paper presents the projected fiscal impacts on Alaska’s Matanuska-Susitna Borough (MSB) and its taxpayers, through year 2050, of six alternative land use and population scenarios. The analysis is focused on population growth and education spending, due to the overwhelming importance of school expenditures in overall borough finances. The Mat-Su Borough is Alaska’s fastest growing borough. Between 2000 and 2012, MSB population grew by 3.8% per year, from about 60,000 to about 94,000. Also, real1 total school expenditures per student (both operating plus capital) increased by 1.6% per year between 2003 and 2012. The State of Alaska currently pays 71% of these total education costs.2 With Alaska oil production decreasing, state education spending per student is likely to decline. Population growth could therefore be costly to MSB residents if school and other costs increase faster than available financial resources.
-

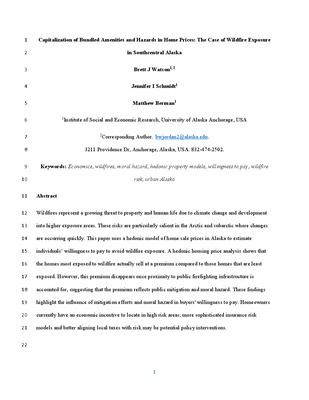
Economics of Wilderness: Contribution of Alaska Parks and Wilderness to the Alaska Economy
Steve Colt and Ginny Fay
"What is the economic contribution of wilderness and wilderness-protected ecosystems to Alaska’s economy? Tourism by nonresidents is the primary link that we consider between wilderness and the Alaska economy, although subsistence harvests and resident recreation clearly generate value for Alaskans. Here, we synthesize and apply existing data and research. We do not consider global ecosystem services provided by Alaska park lands and waters, nor do we assess activity that is not captured within the Alaska economy."
-

Alaska Fuel Price Projections 2014-2040
Ginny Fay and Alejandra Villalobos Meléndez
The Alaska Fuel Price Projections are developed annually for the Alaska Energy Authority (AEA) for the purpose of estimating the potential costs and benefits of renewable energy projects. Project developers submit applications to AEA for grants awarded under the Alaska Renewable Energy Fund (REF) program. These fuel price projections are used to evaluate the economic feasibility of project applications; economic feasibility is only one of many factors of the project evaluation process. Economists at the Institute of Social and Economic Research (ISER), University of Alaska Anchorage (UAA) have completed seven previous Alaska Fuel Price Projections since 2008 (all available at: http://www.iser.uaa.alaska.edu/). In this report we present the methodology for the most recent fuel prices projection. In addition to their use for the REF review, ISER researchers use the projections for other economic research and energy project evaluations. The fuel price projections also fulfill an important need for price information and are used by many stakeholders in addition to AEA. As a result of their broad use among the public, we expanded what used to be cursory notes on methodology. Our intent is to provide more detailed information to the report’s readers and users of the fuel price projections.
-

Electricity in Alaska: A Growing and Changing Picture
Ginny Fay and Alejandra Villalobos Meléndez
You might think Alaskans are using more electricity at home now than they did in 1980, since many live in bigger houses, own more appliances, and have computers and other electronics that were rare 30 years ago. But you’d be wrong: per person residential use of electricity is actually a bit lower today—probably due to a combination of more efficient appliances and increased conservation, as energy prices rose. What did jump sharply was commercial and industrial use per person, reflecting the major economic growth that in recent decades has made Alaska’s economy far bigger and more diverse. This summary shows changes over time in use of electricity in Alaska and describes the current picture, including use by region and sources of electricity—especially renewable sources.
-

Alaska’s Oil Production Tax: Comparing the Old and the New
Oliver Scott Goldsmith
Last year the Alaska Legislature made a controversial change in the oil production tax, the state’s largest source of oil revenue. The old tax, known as ACES (Alaska’s Clear and Equitable Share), was replaced with MAPA (More Alaska Production Act, or SB21). How much money the production tax brings in is a big issue: oil revenues pay for most state government services, and the industry accounts for roughly half of all Alaska jobs. Supporters say the new tax will stimulate North Slope oil investment, leading to more oil production—and so to higher oil revenues and new jobs. Critics say the oil industry doesn’t base investment decisions on tax structure, and that the revised tax is a give-away to the industry. They cite as evidence the $2.1 billion drop in the Alaska Department of Revenue’s forecast of expected 2014 oil revenues after the new law was passed. Alaskans face a choice between the old and the new tax structures this August, when a referendum on the primary election ballot will ask them whether to keep or repeal the new structure. This paper is intended to help Alaskans understand the two systems, which have the same tax base but differ in their tax rates, credits, and treatment of certain new production.
-

Maximum Sustainable Yield: FY 2015 Update
Oliver Scott Goldsmith
This is the third update of a series we began in 2012, estimating how much Alaska’s state government can afford to spend, without risking sudden big budget deficits and economic hardships for Alaskans in the near future. Those problems are looming because oil revenues currently pay almost all the bills for public services—and oil production has been dropping since the late 1980s. But Alaska can extend the benefits from oil, by adding to the Permanent Fund and other financial accounts—so the earnings from financial accounts can increasingly take the place of petroleum revenues. Those revenues are expected to keep dropping, even with revenues from new oil sources and from a potential gas pipeline.
-

2014 Alaska's Construction Spending Forecast
Oliver Scott Goldsmith, Mary Killorin, and Linda Leask
The Construction Industry Progress Fund (CIPF) and the Associated General Contractors (AGC) of Alaska are pleased to have produced another edition of “Alaska’s Construction Spending Forecast.” Underwritten by Northrim Bank, compiled and written by Scott Goldsmith, Mary Killorin and Linda Leask of the University of Alaska’s Institute of Social and Economic Research (ISER), the “Forecast” reviews construction activity, projects and spending by both the private and public sectors for the year ahead. The construction trade is Alaska’s third largest industry, paying the second highest wages, employing nearly 16,000 workers with a payroll over $1 billion. It accounts for 20 percent of Alaska’s total economy and currently contributes approximately $9 billion to the state’s economy. The construction industry reflects the pulse of the economy. When it is vigorous, so is the state’s economy. Both CIPF and AGC are proud to make this publication available annually and hope it provides useful information for you. AGC is a non-profit, full service construction association for commercial and industrial contractors, subcontractors and associates. CIPF is organized to advance the interests of the construction industry throughout the state of Alaska through a management and labor partnership
-

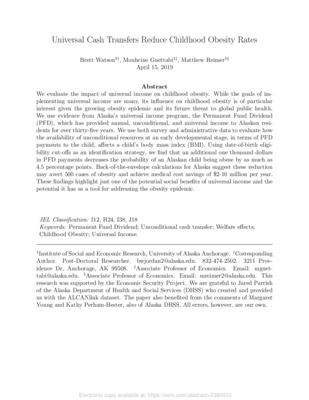
Current and Future Medical Costs of Childhood Obesity in Alaska
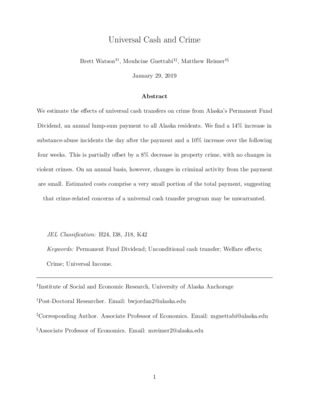
Mouhcine Guettabi
This study examines the medical costs of childhood obesity in Alaska, today and in the future. We estimate that 15.2% of those ages 2 to 19 in Alaska are obese. Using parameters from published reports and studies, we estimate that the total excess medical costs due to obesity for both adults and children in Alaska in 2012 were $226 million, with medical costs of obese children and adolescents accounting for about $7 million of that total. And those medical costs will get much higher over time, as today’s children transition into adulthood. Aside from the 15.2% currently obese, another estimated 20% of children who aren’t currently obese will become obese as adults, if current national patterns continue. We estimate that the 20-year medical costs—discounted to present value—of obesity among the current cohort of Alaska children and adolescents will be $624 million in today’s dollars. But those future costs could be decreased if Alaskans found ways to reduce obesity. We consider how reducing obesity in several ways could reduce future medical costs: reducing current rates of childhood obesity, rates of obese children who become obese adults, or rates of non-obese children and adolescents who become obese adults. We undertake modest reductions to showcase the potential cost savings associated with each of these channels. Clearly the financial\ savings are a direct function of the obesity reductions and therefore the magnitude of the realized savings will vary accordingly. Also keep in mind that these figures are only for the current cohort of children and adolescents; over time more generations of Alaskans will grow from children into adults, repeating the same cycle unless rates of obesity decline. And finally, remember that medical costs are only part of the broader range of social and economic costs obesity creates.
Printing is not supported at the primary Gallery Thumbnail page. Please first navigate to a specific Image before printing.


