
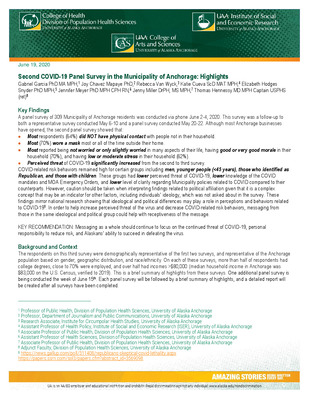
-

Replacement Cost for Public Infrastructure in Alaska: An Update
Oliver Scott Goldsmith
Replacing Alaska’s public infrastructure would cost nearly $59 billion, in today’s dollars. That includes, as the table shows, the costs of replacing public buildings as well as transportation and utility systems.1 This is an update of an estimate ISER made in 2007—which at that time was the first comprehensive estimate of the cost to replace Alaska’s public infrastructure.2 That 2007 estimate was considerably less—about $39.5 billion—but we emphasized at the time that it was preliminary. It did not take into account that costs to replace infrastructure in remote areas are higher, and it undercounted and undervalued certain types of infrastructure, including power and telephone systems. This revised estimate is based on an analysis of cost differences across the state, additional data on existing infrastructure, and additional consultation with engineers, architects, and cost estimators.
-

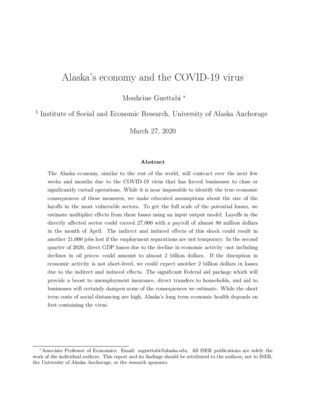
What Drives The Alaska Economy?
Oliver Scott Goldsmith
What drives Alaska’s economy is new money: money coming in from outside the state. How big the economy is, and how much it grows, depends on how much new money comes in. New money comes from “basic” sectors— the sectors that are the basis for all jobs and income across Alaska. They are, in effect, the gears driving the economy. Alaska has eight main basic sectors, but the number of Alaskans they employ directly is small, compared with the number of jobs they support indirectly. Figure 1 shows numbers and shares of jobs for Alaskans that the federal government, the petroleum sector, and the other basic sectors generated on average between 2004 and 2006. The numbers for any specific period aren’t as important as the percentages, which don’t change much from year to year.
-

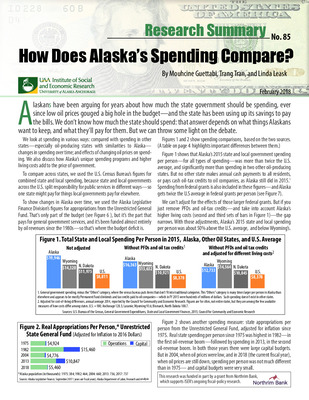
How Vulnerable Is Alaska's Economy to Reduced Federal Spending?
Scott Goldsmith
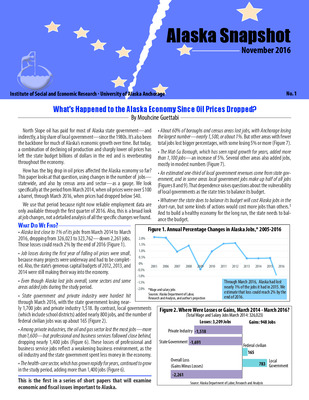
About a third of all jobs in Alaska can be traced to federal spending here—and over the past decade the rapid increase in federal spending drove much of the economic growth. Federal spending in Alaska more than doubled between 1995 and 2005, and in 2006 it was $9.25 billion. But now federal spending here has stopped growing, and many Alaskans are worried that the economy is vulnerable to spending cuts as the federal budget tightens. This analysis estimates that Alaska could be vulnerable to federal spending cuts in the range of $450 million to $1.25 billion—which could cost the economy anywhere from about 7,000 to 20,000 jobs in the future. We estimate potential vulnerability as a range, because it’s impossible to predict with any precision how federal spending will actually change. The best we can do is estimate the likely magnitude of reductions, given federal budget problems.
-

Understanding Alaska's Remote Rural Economy
Scott Goldsmith
In the big, remote stretches of northern and western Alaska, many households keep themselves going with a mix of cash, subsistence, sharing, and other non-cash trading. That’s a world away from the state’s urban economy, and under standard measures like income, the remote rural economy lags far behind. Over the years there have been many efforts to improve the remote rural economy—but there’s a lot we don’t know about it. Standard economic measures don’t capture all the activity in an economy where subsistence, sharing, and non-cash trading play important parts. Some kinds of data don’t even exist. But to develop effective strategies, Alaskans need to understand the economic realities of the remote region. This paper is an overview of the remote economy, based on published data. It’s at best an approximation, because the data are so limited. Still, it’s a first step—and it highlights the many gaps in information. Stretching from the North Slope to the Alaska Peninsula, the remote region covers 395,000 square miles and is large enough to hold Japan, Germany, and Great Britain. Alaska Natives, the region’s aboriginal people, still make up most of the population—although thousands have moved to urban areas in recent times. The 60,500 residents live in five regional centers and about 150 small communities.
-

Viability of Business Enterprises for Rural Alaska: Community Factors and Entrepreneurial Strategies
Sharman Haley, Virginia Fay, Cami Woolam, Jane Angvik, and Linda Leask
-

Southeast Rural Outreach Programs and Education Business Survey
Virgene Hanna and Ann Marbourg
The Rural Outreach Programs and Education (ROPE) is designed to strengthen community and small business competitiveness. It is a multi-pronged business development effort to support economic stability and capacity-building in Southeast Alaska. The program will bring together different entities across the state in a collaborative effort, so the program recipients will have increased levels of technical assistance, training, and communication. One component in this process was to conduct a phone survey of businesses in Southeast Alaska. The survey was designed to determine the specific training and assistance needs of participating communities in Southeast Alaska. By focusing on 13 specific communities and gathering extensive information on each one, ROPE will offer targeted training and workshops, one-on-one confidential counseling, need-specific consultants and seminars, and business training. In May and June of 2008, 128 structured interviews were completed in the 13 communities. The majority of these interviews—88—were with businesses in the private sector, and the remaining 40 were with non-profit, tribal, or municipal organizations. Businesses were asked detailed questions about employees, customers, business expenses, and start-up costs and experiences. The questionnaire was designed to gather information about where employees were from, where customers were from, and the percentage of sales that were to local versus non-local customers. Both businesses and organizations were asked about training they felt would be beneficial and to offer advice to organizations trying to help businesses in Southeast.
-

Kids Count Alaska 2006/2007
Virgene Hanna, Irma Schreiner, Patricia DeRoche, and Claudia Lampman
About This Year’s Book Every year the Kids Count Alaska data book reports on how the children of Alaska are doing. But we also like to tell readers a bit more about life in Alaska, to help them understand the place Alaska’s children call home. This year, we’re celebrating the wildlife that is so much a part of life in Alaska. Alaskans watch, hunt, photograph, and coexist with hundreds of large and small species of animals and birds. That coexistence is not always easy for either the wildlife or the people, but it is always interesting. An increasing number of tourists are also being drawn to Alaska for the opportunity to see wildlife that is either scarce or non-existent in other areas of the United States and the world. The whimsical wildlife illustrations on the cover and at the start of each indicator section are the work of Sebastian Amaya Garber, a talented young artist who grew up in Alaska but is now working toward a degree in industrial design at Western Washington University in Bellingham, Washington. The flip side of each illustration describes something about the specific animals and birds we’re profiling, which are: The sea otter, whose rich fur brought the Russians to Alaska • in the century before the United States bought Alaska The brown bear, one of the most respected and feared land • animals in North America The raven, which plays a big role in Alaska Native culture and • is one of the smartest, toughest birds anywhere The puffin, whose large, yellow-orange bill and orange feet • make it a stand-out in Alaska’s coastal waters The moose, which can weigh up to 1,500 pounds and is • often seen wandering neighborhoods and crossing streets in Alaska’s largest urban areas The humpback whale, whose dramatic breaches make it a • favorite of Alaskans and visitors along the southern coast of Alaska in the summertime Whahat is Kids Count Alaska? Kids Count Alaska is part of a nationwide program, sponsored by the Annie E. Casey Foundation, to collect and publicize information about children’s health, safety, and economic status. We pull together information from many sources and present it all in one place. We hope this book gives Alaskans a broad picture of how the state’s children are doing and provides parents, policymakers, and others interested in the welfare of children with information they need to improve life for children and families. Our goals are: Broadly distributing information about the status of Alaska’s • children Creating an informed public, motivated to help children• Comparing the status of children in Alaska with children • nationwide, and presenting additional Alaska indicators (including regional breakdowns) when possible Who Are Alaska’s Children? More than 206,000 children ages 18 or younger live in Alaska—just under a third of Alaska’s 2006 population of about 671,000. That’s an increase of about 15% in the number of children since 1990. During the past 15 years the age structure of Alaska children has also changed, with younger children making up a declining share and teenagers a growing share. In 1990, children ages 4 or younger made up 31% of all children; by 2006 that share had dropped to 26%. Among those 15 to 18, the 1990 share was about 16%, but it had risen to 22% by 2006. Boys outnumber girls in Alaska by close to 6%. There are more boys than girls in every age group. Even among infants, boys outnumbered girls by 8% in 2006. Alaska’s children have also grown more racially diverse in the past two decades, as illustrated by the figure showing Alaska’s school children by race. In 1988, 68% of school children were White and 32% were from minorities—primarily Alaska Natives.
-

Turnover Among Alaska Teachers: Is It Changing?
Alexandra Hill and Diane Hirshberg
Turnover among Alaska’s teachers was roughly the same in 2007 as it had been in 1999, with about 14% leaving their school districts (Figure 1). Turnover also remained twice as high in rural as in urban districts—about 22%, compared with 10%. That lack of broad change comes after years of efforts by Alaska’s state government, universities, and school districts to reduce teacher turnover, especially in rural areas. The Institute of Social and Economic Research has been tracking Alaska’s progress in reducing teacher turnover since 2004, in partnership with the Alaska Teacher Placement program, the Department of Education and Early Development, and university teacher training programs.
-

It Was Bad or It Was Good: Alaska Natives in Past Boarding Schools
Diane Hirshberg
In 2004 and 2005 my colleagues and I gathered information on the boarding school and boarding home experiences of 60 Alaska Native adults who attended boarding schools or participated in the urban boarding home program from the late 1940s through the early 1980s. From the early 1900s to the 1970s Alaska Natives were taken from rural communities that lacked either primary or secondary schools and sent to boarding schools run by the federal Bureau of Indian Affairs (BIA), by private churches or, later, by Alaska's state government. Some were also sent to boarding homes to attend school in urban places. Their experiences reveal a glimpse of both the positive and negative effects of past boarding schools. Many spoke with ambivalence about their boarding school experience, finding both good and bad elements. This article presents some of the findings of this study.
-

The University of Alaska: How Is It Doing?
Theodore Kassier and Alexandra Hill
Recent reports on higher education in the U.S. say it’s in trouble— that it’s too expensive, doesn’t offer enough need-based aid, isn’t educating people for today’s jobs, doesn’t demand enough of instructors or students, and isn’t sufficiently accountable to policymakers and taxpayers.1 Is the University of Alaska (UA)—the state’s only public university —offering a good, affordable education for Alaskans? This paper looks at that question. It first presents the available data on various measures and then summarizes successes and continuing challenges for UA. It ends with a discussion of how UA and the state are addressing higher-education issues and what other steps they might consider. UA has made substantial progress on a number of goals in the past decade. For example, it’s attracting a growing share of Alaska’s college-bound freshmen, and it’s educating many more students for jobs in high-demand areas like health care and technology. The school’s overall retention and graduation rates are improving. But UA also faces many of the same issues as other public universities— like sharp increases in tuition and significant numbers of students who come out of high school unable to read, write, or do math at college-level.
-

The University of Alaska: How Is It Doing?
Theodore Kassier and Alexandra Hill
Recent reports on higher education in the U.S. say it’s in trouble— that it’s too expensive, doesn’t offer enough need-based aid, isn’t educating people for today’s jobs, doesn’t demand enough of instructors or students, and isn’t sufficiently accountable to policymakers and taxpayers.1 Is the University of Alaska (UA)—the state’s only public university —offering a good, affordable education for Alaskans? This paper looks at that question. It first presents the available data on various measures and then summarizes successes and continuing challenges for UA. It ends with a discussion of how UA and the state are addressing higher-education issues and what other steps they might consider.
-

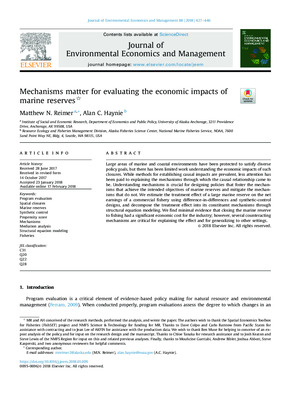
The Value of Evidence-Based Computer Simulation of Oral Health Outcomes for Management Analysis of the Alaska Dental Health Aide Program
Daniel P. Kiley, Sharman Haley, Ben Saylor, and Brian L. Saylor
Objectives: To create an evidence‐based research tool to inform and guide policy and program managers as they develop and deploy new service delivery models for oral disease prevention and intervention. Methods: A village‐level discrete event simulation was developed to project outcomes associated with different service delivery patterns. Evidence‐ based outcomes were associated with dental health aide activities, and projected indicators (DMFT, F+ST, T‐health, SiC, CPI, ECC) were proxy for oral health outcomes. Model runs representing the planned program implementation, a more intensive staffing scenario, and a more robust prevention scenario, generated 20‐year projections of clinical indicators; graphs and tallies were analyzed for trends and differences. Results: Outcomes associated with alternative patterns of service delivery indicate there is potential for substantial improvement in clinical outcomes with modest program changes. Not all segments of the population derive equal benefit when program variables are altered. Children benefit more from increased prevention, while adults benefit more from intensive staffing. Conclusions: Evidence‐ based simulation is a useful tool to analyze the impact of changing program variables on program outcome measures. This simulation informs dental managers of the clinical outcomes associated with policy and service delivery variables. Simulation tools can assist public health managers in analyzing and understanding the relationship between their policy decisions and long‐term clinical outcomes.
-

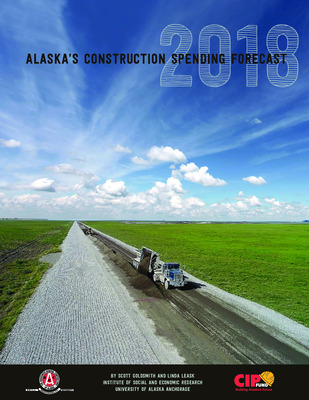
2008 Alaska's Construction Spending Forecast
Mary Killorin and Scott Goldsmith
Total construction spending “on the street” in Alaska in 2008 will be $7.01 billion, down 2% from last year. Excluding the oil and gas sector—which accounts for 41% of the total—construction spending will be down for the second year in a row, falling 6% to $4.12 billion. Last year it declined 3%. Lower construction spending, combined with higher material and labor costs, will result in a modest reduction in the level of construction employment in 2008. Although this will be the second year of decline in construction employment, it remains well above the long-term trend. Construction costs continue to rise faster than the general rate of inflation—and that trend is expected to continue, further reducing the purchasing power of each construction dollar. Private-sector construction spending is projected to be $4.64 billion in 2008, an increase of 2% over 2007. Strong growth is expected in oil and gas, mining, utilities, and the other basic sectors.
-

Fuel Costs, Migration, and Community Viability
Stephanie Martin, Mary Killorin, and Steve Colt
ISER researchers compiled and reviewed existing studies and data sources relating to the economic and social viability of remote rural Alaska communities. We particularly looked for possible linkages between high fuel costs and migration. Our review indicates the following: (1) migration from smaller places toward larger places is an ongoing phenomenon that is more noticeable when birth rates drop; (2) there is no systematic empirical evidence that fuel prices, by themselves, have been a definitive cause of migration; (3) the pursuit of economic and educational opportunities appears to be a predominant cause of migration; (4) however, currently available survey data are not sufficient to definitively determine other reasons for migration, which could include concerns about public safety and/or alcohol abuse; 5) most of the survey data pre-date the latest rapid increase (2006-2008) in fuel prices. We suggest several ways that better data could be collected on community viability and the reasons for migration.
-

Alaska Election Security Report, Phase 2, Executive Summary
Stephanie Martin, LuAnn Picard, Mark Ayers, David B. Hoffman, and Kenrick Mock
A laska’s election system is among the most secure in the country, and it has a number of safeguards other states are now adopting. But the technology Alaska uses to record and count votes could be improved— and the state’s huge size, limited road system, and scattered communities also create special challenges for insuring the integrity of the vote. In this second phase of an ongoing study of Alaska’s election security, we recommend ways of strengthening the system—not only the technology but also the election procedures. The lieutenant governor and the Division of Elections asked the University of Alaska Anchorage to do this evaluation, which began in September 2007.
-

State of Alaska Election Security Project Phase 2 Report
Stephanie Martin, LuAnn Picard, Mark Ayers, David B. Hoffman, and Kenrick Mock
A laska’s election system is among the most secure in the country, and it has a number of safeguards other states are now adopting. But the technology Alaska uses to record and count votes could be improved— and the state’s huge size, limited road system, and scattered communities also create special challenges for insuring the integrity of the vote. In this second phase of an ongoing study of Alaska’s election security, we recommend ways of strengthening the system—not only the technology but also the election procedures. The lieutenant governor and the Division of Elections asked the University of Alaska Anchorage to do this evaluation, which began in September 2007.
-

Viability of Business Enterprises for Rural Alaska Volume III: Appendices
G. Williamson McDiarmid, Oliver Scott Goldsmith, Mary Killorin, Suzanne Sharp, and Carl Hild
-

Connecting a Disjointed System: A First Look at Aligning Education in Alaska
G. Williamson McDiarmid and Alexandra Hill
We’ve heard it before, but it’s still true: too many Alaska students don’t have the skills they need to move on to the next stage of education or to get good jobs. Too many drop out of high school, and too few of those who graduate go on to college or other post-secondary education—and among those who do go on to post-secondary education, many don’t graduate within four or even six years. Employers report that young people entering the work world directly after they graduate from high school (or right after they drop out) don’t have the reading, writing, and math skills necessary for many of today’s jobs, even entry-level ones. Alaska is not alone in these problems, but the high-school dropout rate is higher than the U.S. average and fewer graduates go to college. A third of Alaska’s high-school students don’t even graduate, and only about a third graduate and start college right away (Figure 1).
-

Estimated Household Costs for Home Energy Use
Ben Saylor, Sharman Haley, and Nick Szymoniak
This memo estimates how much of their income Alaska households spend for home energy uses, after years of rising energy prices.1 We made the estimates at the request of State Senator Lyman Hoffman. We include costs for electricity, heat, and other home energy uses—but do not include costs for transportation fuel. Keep in mind that these are truly estimates. Because of time lags in data collection and reporting, actual consumer price data for 2008 are not available. To estimate consumer energy prices as of May 2008, we used statistical models of the relationship between oil prices and consumer prices. We also used the most recent data on per capita personal income from the Bureau of Economic Analysis to estimate 2007 annual household income. These estimates are likely to overstate actual household expenditures. As energy costs rise, households find ways to consume less. How much less, we don’t know. For these estimates, we used consumption households reported at the time of the 2000 U.S. Census. Also, the estimates in this memo reflect what energy would cost households for a year, at May 2008 prices. Consumers of course haven’t yet seen a full year at these prices, and we don’t know where prices will go from here.2 Therefore, these estimates are really like a cost index—that is, they estimate what it would cost to buy a specific amount of energy, at specific prices. That’s not the same as actual annual household expenditures. Still, these estimates give a good picture of what
-

Alaska Community Fuel Use
Ben Saylor, Meghan Wilson, Nick Szymoniak, Ginny Fay, and Steve Colt
The goal of this project was to estimate the amount of fuel used for space heating and electricity production by communities in Alaska. No comprehensive Alaska fuel use data exist at the community level. Community fuel consumption by type of fuel and end use is needed to estimate the potential economic benefits from demand- and supply-side investments in fuel use reduction projects. These investments include weatherization and housing stock improvements; improved lighting, appliance and space heating efficiencies; waste heat capture; electric interties, and alternative energy supply options such as wind and hydroelectric generation. Ultimately the Alaska Energy Authority (AEA) and others can use this information to rank and select a suite of projects that provide the largest gains in fuel reductions at the lowest long-term costs and the highest returns on investment over the life of the projects. Study communities consisted of Power Cost Equalization (PCE) eligible communities. Communities in the North Slope Borough were excluded because fuel subsidies offered by the borough result in different patterns of energy use by households.
-

UAA Inventory: Greenhouse Gas Emissions From Transportation
Nick Szymoniak, Kelcie Ralph, and Steve Colt
As a signatory of the American College and University Presidents Climate Commitment, UAA has agreed to conduct an inventory of its greenhouse gas (GHG) emissions. This inventory serves as a baseline against which to measure the effectiveness of GHG emissions reduction projects. To fulfill the Commitment UAA agreed to conduct an inventory of its Scope 1 and 2 emissions, as well as some Scope 3 emissions. In addition to signing the Presidents Climate Commitment, UAA signed the Talloires Declaration in April 2004. The Talloires Declaration is a statement of principles and practices for using higher education to promote sustainability. Scope 1 emissions are defined as direct GHG emissions occurring from sources that are owned or controlled by the institution. Scope 2 emissions are indirect emissions generated in the production of energy purchased by the institution. Scope 3 emissions are indirect emissions that are the consequence of the activities of the institution, but occur from sources not owned or controlled by the institution. Pursuant to the Commitment, this study estimates the levels of two types of Scope 3 GHG emissions – commuting by students and employees, and university-funded air travel. Scope 1 and Scope 2 GHG emissions are being estimated in a separate study. Two models were developed and used: a UAA commuter model and a UAA air travel model.
-

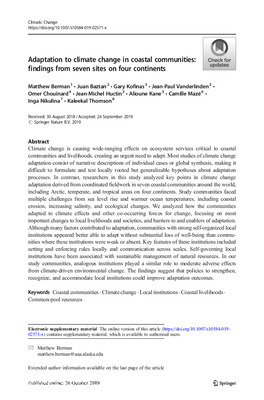
Local Perceptions and Regional Climate Trends on the Central Plateau of Burkina Faso
C.T. West, C. Roncoli, and F. Ouattara
Due to devastating droughts in the 1970s and 1980s, climatic and environmental change in the West African Sahel has attracted a great deal of scientific research. While many of these studies documented a long-term trend of declining rainfall, analyses conducted in the last few years suggest that a ‘recovery’ is underway. Drawing on ethnographic interviews, focus groups, and participant observation in two Provinces of the Central Plateau of Burkina Faso, we elicited local perspectives on these rainfall trends from the people who are most directly affected, namely local farmers. Fieldwork revealed that farmers in the research sites perceive that both overall seasonal rainfall and the number of ‘big rains’ during the rainy season have decreased over the last 30 years. We then tested these perceptions against rainfall records from nearby meteorological stations and found them to be corroborated. This paper illustrates how farmers of the Central Plateau now view drought as ‘normal’, having incorporated drought-mitigation adaptations into their agricultural systems. Our case study highlights the need for ground truthing scientific analyses and assessing livelihood implications at the local level. It also advocates for sustained institutional support for rural communities, to increase their ability to adapt to climate change.
Printing is not supported at the primary Gallery Thumbnail page. Please first navigate to a specific Image before printing.


