
-

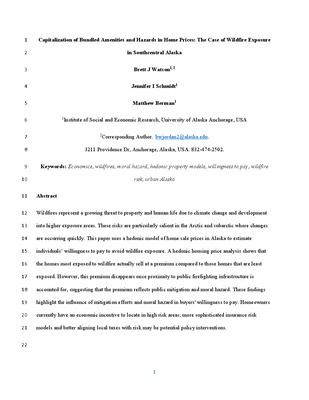
Health Effects of Indoor-Air Benzene in Anchorage Residences: A Study of Indoor-Air Quality in Houses with Attached Garages
Mary Ellen Gordian, Rosyland Frazier, Alexandra Hill, Irma Schreiner, Darla Siver, Alistair Stewart, and Steve Morris
Benzene is a known carcinogen. It affects white blood cells; it causes leukemia and aplastic anemia. It may also affect the immune system which is dependent on white blood cells.1 It has been removed from all household products, but it is still present in gasoline. Alaskan gasoline is particularly high in benzene (>5%). Gasoline refined in Alaska has high concentrations of benzene and other the aromatic compounds as much as 50% aromatics by volume. Leaving the aromatics in the gasoline helps cars start in the cold, but it also puts high concentrations of benzene in both the ambient and indoor air. We already knew from previous work done in Alaska by Bernard Goldstein in Valdez2 and the Anchorage Department of Health and Human Services in Anchorage3 that people were exposed to high ambient levels of benzene in the winter, and that there were high indoor benzene concentrations in homes with attached garages if the garage was used to store gasoline or gasoline powered engines. Benzene does not bioaccumulate in the body as dioxin or some pesticides do. But are its effects cumulative? Does a little dose of benzene everyday have the same effect as a large dose over less time? Benzene reduces CD4 cells in a dose-response manner at workplace concentrations less than 1 ppm (OSHA 8-hour exposure limit) in workers.4 People who live in homes with high benzene concentrations may be exposed 24 hours a day, seven days a week. There have been no studies of health effects of such environmental exposure to benzene. This study was done to determine three things: 1. What percentage of Anchorage homes with attached garages had high levels of indoor benzene? 2. Were the high levels of indoor benzene affecting the health of the residents? 3. Were residents more likely to develop asthma in homes with high levels of indoor benzene?
-

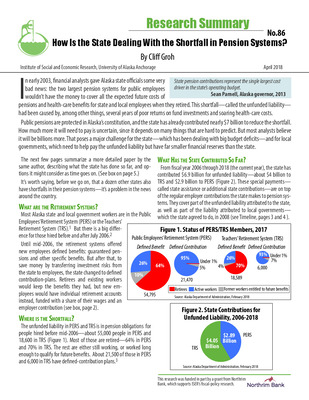
Kids Count Alaska 2008
Virgene Hanna, Linda Leask, Claudia Lampman, Irma Schreiner, and Patricia DeRoche
We’re pleased to announce that Kids Count Alaska is part of a new site, the Kids Count Data Center (datacenter.kidscount.org). Developed by the KIDS COUNT national program, the site gives easy access to data on children and teenagers for every state and hundreds of cities and counties across the country. For Alaska, you can select indicators for each of the state’s seven regions and create your own maps, trend lines, and charts. There are also maps and graphs you can put on your Web site or blog. You can go directly to that national site, or you can link from our Web site (www.kidscount.alaska.edu). We hope you’ll find the new data and features helpful. This book and all previous data books are available on our Web site, and each data book is divided into sections for faster downloading. Also on our site is a link to the most recent national KIDS COUNT data book, as well as to other publications and reports. About This Year’s Book Alaska is celebrating 50 years as a state in 2009—and as part of the celebration, we decided to illustrate this year’s data book with historic photos of Alaska’s children before statehood. We also used information from the U.S. Census Bureau to take a broad look at how conditions have changed for Alaska’s children since statehood. In the Highlights at the end of this section (pages 7 to 10) you’ll find some comparisons of the social and economic wellbeing of children in Alaska in 1959 and today. What is Kids Count Alaska? Kids Count Alaska is part of a nationwide program, sponsored by the Annie E. Casey Foundation, to collect and publicize information about children’s health, safety, and economic status. We pull together information from many sources and present it all in one place. We hope this book gives Alaskans a broad picture of how the state’s children are doing and provides parents, policymakers, and others interested in the welfare of children with information they need to improve life for children and families. Our goals are: • Distributing information about the status of Alaska’s children • Creating an informed public, motivated to help children • Comparing the status of children in Alaska with children nationwide, and presenting additional Alaska indicators (including regional breakdowns) when possible
-

An Exploration of Experiences and Outcomes of Alaska Native Graduates of Mt. Edgecumbe High School
Diane Hirshberg and Brit DelMoral
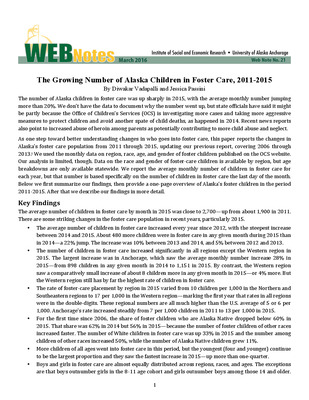
In Alaska’s schools, indigenous1 students are the most at risk of any ethnic group of failing to thrive; they drop out more frequently, are less likely to graduate, and generally have lower educational attainment than non-Native students(Martin and Hill, 2009). Indeed, the situation appears to be worsening. The dropout rate of Alaska Native students living in all areas of Alaska besides Anchorage has risen from 0.7 percent in 1996 to 3.3 percent in 2001 (Goldsmith et al. 2004). Dropout rates among all Native students in Alaska increased from 5 percent to almost 10 percent between 1998 and 2001, while the dropout rate among non-Native students increased from about 3 percent to 5 percent (ibid). In addition, low test scores are preventing many students from graduating from high school—almost half of Alaska Native students are not passing the reading section of the High-School Graduation Qualifying Exam. The educational system in Alaska is failing to provide Alaska Native students the skills necessary either for postsecondary academic work or success in the job market, if that is what they desire. However, one secondary school, Mt. Edgecumbe High School, a boarding school located in Southeast Alaska that serves predominately rural and Alaska Native students, has produced students that consistently outperform their peers, both indigenous and non- Native. The reputation of the school has been strong for decades, based on both historic and recent accomplishments of its alumni. However, the experiences of recent alumni at the school and their professional and educational attainment after high school had not been looked at systematically for a number of years. This paper is the result of a study conducted by the authors on recent graduates of Mt. Edgecumbe High School (MEHS), at the suggestion of school administrators. Our case study attempts to capture the educational, social, and cultural experiences of the students while they attended the boarding school, and the impacts the school has had on their lives. With this research we hope to inform the decisions o f policymakers and educators, indigenous and non-Native alike, regarding rural secondary schooling options in Alaska for indigenous children across the state.
-
 Program to Alaska Natives and Alaska by University of Institute of Social and Economic Research, Sharman Haley, Ginny Fay, Joel Ainsworth, Jane Angvik, Alexandra Hill, and Stephanie Martin")
Benefits of Alaska Native Corporations and the SBA 8(a) Program to Alaska Natives and Alaska
University of Institute of Social and Economic Research, Sharman Haley, Ginny Fay, Joel Ainsworth, Jane Angvik, Alexandra Hill, and Stephanie Martin
Senator Begich’s office asked ISER for assistance assembling information to document the social and economic status of Alaska Natives and the benefits of the 8(a) program. His purpose is to brief Missouri Senator McCaskill and her committee which is reviewing the status of ANC contracts awarded under SBA’s 8(a) program. This review was triggered by a 2006 GAO report recommending increased SBA oversight to 8(a) contracting activity. Highlights of the GAO report are provided in Tab A.1; a letter dated May 15, 2009, from Senators Begich and Murkowski to Sentaor McCaskill, outlining their concerns is provided in Tab A.2. As the Congressional Research Service report (Tab A.3) explains, the Small Business Administration’s 8(a) program targeting socially and economically disadvantaged individuals was operating under executive authority from about 1970, and under statutory authority starting in 1978. A series of amendments from 1986 to 1992 recognized Alaska Native Corporations (ANCs) as socially and economically disadvantaged for purposes of program eligibility, exempted them from limitations on the number of qualifying subsidiaries, from some restrictions on size and minimum time in business, and from the ceiling on amounts for sole-source contracts. Between 1988 and 2005, the number of 8(a) qualified ANC subsidiaries grew from one to 154 subsidiaries owned by 49 ANCs. The dollar amount of 8(a) contracts to ANCs grew from $265 million in FY 2000 to $1.1 billion in 2004, approximately 80 percent of which was in sole-source contracts. (GAO Highlights, Tab A.1) The remainder of this briefing book is divided in three sections. Section 2 addresses changes in the social and economic status of Alaska Natives from 1970--the year before the enactment of the Alaska Native Claims Settlement Act and the subsequent creation of the ANCs--to the present. ISER’s report on the “Status of Alaska Natives 2004” (Tab B.1) finds that despite really significant improvements in social and economic conditions among Alaska Natives, they still lag well behind other Alaskans in employment, income, education, health status and living conditions. A collection of more recent analyses updates the social and economic indicators to 2008. There were many concurrent changes throughout this dynamic period of Alaska’s history and we cannot attribute all the improvements to the ANCs, though it is clear that they play an important catalyst role. In the final part of section 2 we attempt to provide some historical context for understanding the role ANCs have played in improving the well-being of Alaska Natives. Section C. documents the growth in ANCs and their contributions to Alaska Native employment, income, social and cultural programs and wellbeing, and their major contributions to the Alaska economy and society overall. Section D. Looks specifically at the 8(a) program. Although there are a handful of 8(a) firms with large federal contracts, the majority are small, village-based corporations engaged in enterprise development in very challenging conditions. A collection of six case studies illustrate the barriers to business development these small firms face and the critical leverage that 8(a) contracting offers them.
-

Municipality of Anchorage Baseline Greenhouse Gas Emissions Inventory Base Year 2008
Ralph Kelcie and Marcus Welker
The Municipality of Anchorage (MOA) conducted a greenhouse gas (GHG) emissions inventory with a 2008 base year in order to quantify the results of initiatives to reduce the MOA’s current carbon footprint, place those initiatives into a broader strategic plan, and measure reductions going forward. The MOA conducted the carbon baseline because it is a signatory of the U.S. Mayors Climate Protection Agreement. Over 710 U.S. Mayors have signed the agreement. Under the agreement, Anchorage must attempt to meet or beat the Kyoto Protocol targets of 7% reduction from 1990 levels by 2012, encourage their state governments and federal government to meet or beat the Kyoto Protocol targets, and urge the U.S. Congress to pass greenhouse gas reduction legislation establishing a national emissions trading system. The greenhouse gas emissions inventory is the first step for Anchorage to begin measuring the reductions of greenhouse gases as the MOA strives to meet the 7% reduction goal by 2012. The MOA chose to adopt the framework developed by the Local Governments for Sustainability (ICLEI) for measuring progress toward reduction goals because of its wide use, standardized methodology, and proven results. The ICLEI strategy has been adopted worldwide by over 1,000 communities working toward meet Kyoto Protocol carbon emission reduction targets.
-

2009 Alaska Health Workforce Vacancy Study
Beth Landon, Sanna Doucette, Rosyland Frazier, Meghan Wilson, Darla Silver, Alexandra Hill, Kate Sanders, Suzanne Sharp, Kristin Johnson, Patricia DeRoche, Stephanie Martin, and Donna Prator
Alaska continues to experience health professional shortages. The state has long had a deficient “supply side” characterized by insufficient numbers of key health workers whose recruitment, retention, and training have been impeded by Alaska’s remoteness, harsh climate, rural isolation, low population density, and scarce training resources. Alaska is the only state without a pharmacy school and lacks its own dental and physical therapy schools as well. Health professional shortages can be decreased through the start of new training programs, the expansion of existing programs, and the improvement of the effectiveness of recruitment and retention efforts. However, strategic planning and the execution of such programs require valid and accurate data. To this end, stakeholders such as the Alaska Mental Health Trust Authority (AMHTA) and Alaskan's For Access to Health Care (ACCESS), along with schools and departments within the University of Alaska Anchorage (UAA), funded the Alaska Center for Rural Health-Alaska’s AHEC (ACRH) and the Institute of Social and Economic Research (ISER) to conduct a comprehensive health workforce study during winter and spring of 2009. This report highlights employers’ needs for employees to fill budgeted positions. This is different from a needs assessment that would take into account population demographics and disease incidence and prevalence. This health workforce study is an assessment of health manpower shortage based on budgeted staff positions and their vacancies in organizations throughout the state. Respondents included part-time positions, which resulted in our counting full-time equivalent (FTE) rather than individuals (“bodies”). In situations where a position was divided among more than one occupation (e.g., Dental Assistant and Billing Clerk), we asked the respondent to count the position under which they considered the position’s “primary occupation.” This was a point-in-time cross-sectional study. Recently filled vacancies or imminent vacancies were not counted. Positions filled by relief/temporary/locum/contract health workers were counted as vacancies only if these workers were temporarily filling a currently vacant, budgeted position. Due to budget and time constraints, we were not able to conduct a trend analysis that is a comparison of this study’s findings and the prior 2007 study. The key questions this study sought to answer were (1) How many budgeted positions, either full- or part-time, existed in organizations providing health services in Alaska? (2) How many of these budgeted positions were currently vacant? (3) What was the vacancy rate? (4) How many of the organizations that employ these occupations hired new graduates of training programs? (5) How many of the currently vacant budgeted positions (#2) could be filled by new graduates of training programs? (6) What were the mean and maximum length of time, expressed in months, that the vacancies have existed? (7) What were the principal, underlying causes of vacancies? The study was designed in consultation with an advisory group that included AMHTA, ACCESS, and UAA. The study targeted 93 health occupations. The unit of analysis was the employment site by organization type, which allowed for the allocation of positions and vacancies by geographic region. For each employer, we identified the staff person most knowledgeable about hiring and vacancies. In large organizations this meant that one employer might provide information about multiple sites and organization types; smaller employers were responsible for only a single site.
-

Alaska’s People and Economy, 1867-2009
Linda Leask, Oliver Scott Goldsmith, Gunnar Knapp, and Steve Colt
Utterly worthless. That’s how a congressman from Missouri described Alaska in 1867, when the U.S. bought it from Russia. A lot of Americans agreed. For almost 100 years, hardly anyone— except some Alaskans—wanted Alaska to become a state. But Alaska did finally become a state, in 1959. Today, after 142 years as a U.S. possession and 50 years as a state, Alaska has produced resources worth (in today’s dollars) around $670 billion. The U.S. paid $7.2 million for Alaska, equal to about $106 million now. For perspective, that’s roughly what the state government collected in royalties from oil produced on state-owned land in just the month of March 2009. To help mark 50 years of statehood, this publication first takes a broad look at what’s changed in Alaska since 1959. That’s on this page and the back page. We’ve also put together a timeline of political and economic events in Alaska from 1867 to the present. That’s on the inside pages. There’s an interactive version of the timeline—with photos, figures, and more—on ISER’s Web site: www.iser.uaa.alaska.edu.
-

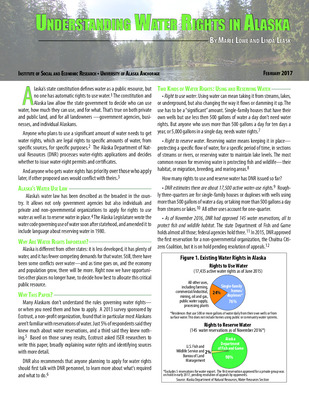
New Students in the Anchorage School District: Where Are They From?
Marie E. Lowe, Patricia DeRoche, Suzanne Sharp, and Meghan Wilson
In September 2008, the superintendent of the Anchorage School District and the mayor of Anchorage sent a letter to the governor of Alaska, reporting what they thought might be an influx of students into Anchorage from rural communities. Enrollment in the school district was higher than expected, and it coincided with the largest-ever Alaska Permanent Fund dividend and with a one-time payment of $1,200 the state made per person, to help offset high energy costs. Researchers at the Institute of Social and Economic Research (ISER) at UAA have a longstanding interest in migration patterns in Alaska and the Arctic, and they saw the increased enrollment in Anchorage schools as a potential opportunity to better understand: • If rural Alaskans are moving to Anchorage • Where they are coming from • Why they are moving So with the cooperation of the Anchorage School District, ISER conducted a survey of the parents or guardians of students who had enrolled in Anchorage in the 2007-2008 or 2008-2009 school years and who had transferred in from other Alaska school districts. Besides finding out where students were coming from—and why—another purpose of the study was to provide the Anchorage School District and the Municipality of Anchorage with information about what they could do to help students and families who are new to the city. To our knowledge, this may be the first survey ever conducted to find out why people move to Anchorage from other areas of Alaska.
-

The Cost of Crime: Could The State Reduce Future Crime and Save Money by Expanding Education and Treatment Programs ?
Stephanie Martin and Steve Colt
Alaska’s prison population is among the fastest-growing in the U.S., with five times more inmates in 2007 than in 1981. Spending for the state justice system has nearly doubled since 1981—but the crime rate has dropped only about 30%. Here’s the dilemma for the state, given the pattern shown in Figure 1: what can it do to hold down the number of inmates and stem the rising costs—while at the same time keeping the public safe and using tax dollars effectively? Senator Hollis French asked ISER to project growth in the number of Alaska inmates and the associated costs—and then evaluate whether the state could reduce that growth by expanding intervention and prevention programs for people already in prison or at risk of ending up there. Alaska currently spends about $17 million a year for such programs, but they aren’t available to many of those who might benefit from them.
-

The Changing Economic Status of Alaska Natives, 1970-2007
Stephanie Martin and Alexandra Hill
Forty years ago—when the discovery of North Slope oil was about to transform Alaska’s economy— Alaska Natives had among the lowest income, employment, and education levels in the U.S. Today their economic conditions are better, but they still fall considerably below averages among other Alaskans and other Americans. This note first reports how current economic conditions among Alaska Natives compare with U.S. averages, and then looks at changes since 1970 in poverty, employment, income, and education levels among Alaska Natives. We relied mainly on data from federal censuses in 1970, 1980, 1990, and 2000 and from the annual American Community Survey for 2005 to 2007. We also used the most recent population estimates from the Alaska Department of Labor and Workforce Development.1
-

Yup’ik Language Assistance Tribal Outreach: Report to the Alaska Division of Elections
Stephanie Martin, Mary Killorin, Suzanne Sharp, and Patricia DeRoche
The Division of Elections contracted with the Institute of Social and Economic Research (ISER) at the University of Alaska Anchorage to help develop a network of key tribal organization and village representatives in the Bethel census area to work with the division on their Yup’ik language assistance program. The division asked ISER to help them communicate with tribes about the division’s current programs and to document additional ways that the division can improve its language assistance program. The Alaska Division of Elections is required under the Federal Voting Rights Act (VRA) to provide language assistance to voters in areas where more than 5% of the voting age citizens are members of a single-language minority and are limited English proficient. In July 2008, a federal court ordered the division to take the following remedial actions, many of which the division had already taken prior to the court order: 1. Provide mandatory poll worker training. 2. Hire a language assistance coordinator fluent in Yup'ik. 3. Recruit bi-lingual poll workers or translators. 4. Provide sample ballots in written Yup'ik. 5. Provide pre-election publicity in Yup'ik. 6. Ensure the accuracy of translations. 7. Provide a Yup'ik glossary of election terms. 8. Submit pre-election and post-election reports. Although the division has a Yup’ik language assistance program and has been addressing the court order, interviews with Bethel census area residents show that some people are unaware of the elements in the division’s language assistance plan. In addition, some Bethel area residents said they feel the election workers and the division should interpret the meaning of the ballot measures and explain the positions of the various candidates—activities that are forbidden by state statute. ISER agreed to help the division address this lack of awareness and the misconceptions about their programs by contacting tribal organizations and inviting them to attend a meeting in Bethel, Alaska, on May 27, 2009. Part I of this report, issued in July 2009, describes ISER’s contacts with tribal organizations and summarizes the comments and feedback from the participants at the election outreach meeting in Bethel. Part II describes ISER’s post-meeting contacts with tribal organizations and meeting participants and summarizes their responses to the post-meeting survey.
-

2009 Alaska Health Workforce Vacancy Study - Report and Appendices
N/A N/A
Health professional shortages can be decreased through the start of new training programs, the expansion of existing programs, and the improvement of the effectiveness of recruitment and retention efforts. However, strategic planning and the execution of such programs require valid and accurate data. To this end, stakeholders such as the Alaska Mental Health Trust Authority (AMHTA) and Alaskan's For Access to Health Care (ACCESS), along with schools and departments within the University of Alaska Anchorage (UAA), funded the Alaska Center for Rural Health-Alaska’s AHEC (ACRH) and the Institute of Social and Economic Research (ISER) to conduct a comprehensive health workforce study during winter and spring of 2009. This report highlights employers’ needs for employees to fill budgeted positions. This is different from a needs assessment that would take into account population demographics and disease incidence and prevalence. This health workforce study is an assessment of health manpower shortage based on budgeted staff positions and their vacancies in organizations throughout the state. Respondents included part-time positions, which resulted in our counting full-time equivalent (FTE) rather than individuals (“bodies”). In situations where a position was divided among more than one occupation (e.g., Dental Assistant and Billing Clerk), we asked the respondent to count the position under which they considered the position’s “primary occupation.” The study was designed in consultation with an advisory group that included AMHTA, ACCESS, and UAA. The study targeted 93 health occupations. The unit of analysis was the employment site by organization type, which allowed for the allocation of positions and vacancies by geographic region. APPENDICES: Appendix A. List of Health Occupations, Appendix B. Health Workforce Surveys, Appendix C. Cover Letter Accompanying Survey Forms, Appendix D. Confidence Intervals for Positions, Vacancies, Number of Vacancies Filled with New Graduates, and Length of Longest Vacancy in Months, Appendix E. Tables of Samples and Estimates of Positions, Vacancies, Vacancy Rates, Number of Vacancies Filled with New Graduates, Mean and Maximum Length of Longest Vacancy in Months, Appendix F. Tables of Occupations Sorted By Estimates of Positions, Vacancies, Vacancy Rates, Number of Vacancies Filled with New Graduates, Mean and Maximum Length of Longest Vacancy in Months
-

Benefits of the Cook Inlet Ferry to the Municipality of Anchorage
Nick Szymoniak and Steve Colt
The purpose of this study is to examine the economic benefits of the Cook Inlet Ferry to the Municipality of Anchorage. The Cook Inlet Ferry is currently being built at the Ketchikan, Alaska shipyard. The U.S. Navy has financed construction of the ferry as a prototype military landing craft for northern, ice-filled waters. The Matanuska-Susitna Borough paid for Ferry engineering, design, and outfitting with federal transit monies. Following short-term Navy testing of the craft, it will be transferred to the Borough to provide ferry service in Cook Inlet. The Borough will provide operating and maintenance information to the Navy on an ongoing basis. The Borough will operate the ferry, which will provide regular service between Anchorage and Port MacKenzie as well as service to other points on Cook Inlet. The Ferry is expected to be operational by 2010.
-

Viability of Business Enterprises for Rural Alaska Volume II: Business Case Studies
Jane Angvik, Linda Ketchum, and Steve Colt
-

Comments on the Lieberman-Warner Climate Security Act and Lieberman-Warner proposed legislation
Steve Colt
The Lieberman-Warner Climate Security Act (hereafter LW or “the Act”) aims to cover 87% of total U.S. greenhouse gas (GHG) emissions.2 It aims to reduce the emissions of those gases by 4% below year 2005 levels in 2012 and by 17% below 2005 levels in 2020. The Act would impose a cap-and-trade mechanism on most energy-using activities. The number of emissions allowances would be limited in order to keep total emissions in each year below the predetermined cap. The interaction of buyers and sellers of emissions allowances would determine a market price per ton of CO2 equivalent. The Act allows emitters to trade, save, and borrow allowances, so that the most cost-effective GHG emissions reductions can be made where and when they are available. The American Council for Capital Formation and the National Association of Manufacturers (ACCF/NAM) recently issued a report3 that projects some of the economic effects of implementing LW. Both effects on the U.S. economy and effects on individual states are projected. The analysis was conducted by Science Applications International Corporation using the National Energy Modeling System (NEMS). NEMS is a set of interlinked computer models that project energy supply and demand and key macroeconomic outcomes such as gross domestic product and employment. Many assumptions are required as inputs into NEMS. The assumptions driving the ACCF/NAM results were provided by ACCF and NAM. They were not chosen by the consultants who ran the model. Two sets of assumptions were used to generate two set of projections: a “Low Cost” scenario and a “High Cost” scenario.
-

Economic Analysis of an Integrated Wind-Hydrogen Energy System for a Small Alaska Community
Steve Colt and Steve Gilbert
Wind-hydrogen systems provide one way to store intermittent wind energy as hydrogen. We explored the hypothesis that an integrated wind-hydrogen system supplying electricity, heat, and transportation fuel could serve the needs of an isolated (off-grid) Alaska community at a lower cost than a collection of separate systems. Analysis indicates that: 1) Combustible Hydrogen could be produced with current technologies for direct use as a transportation fuel for about $15/gallon-equivalent; 2) The capital cost of the wind energy rather than the capital cost of electrolyzers dominates this high cost; and 3) There do not appear to be diseconomies of small scale for current electrolyzers serving a a village of 400 people.
-

How Would$1,200 Per Person State Payments Compare With Increased Household Costs for Energy Use?
Steve Colt and Ben Saylor
In the face of sharply rising energy costs, Alaska’s governor, Sarah Palin, has proposed to pay every Alaskan $1,200 to help cover those increased costs. The Alaska Legislature will be considering the governor’s proposal in the special session that began July 9. How would the proposed payments—about $3,300 for the average-size Alaska household—compare with recent increases in energy costs? We looked at that question and present our estimates here. But these truly are estimates, because there’s not much current information about the types and amounts of energy Alaska households use.
-

Alaska Fuel Price Projections 2008 - 2030
Steve Colt, Ben Saylor, and Nick Szymoniak
We generated Low, Medium, and High case fuel price projections for the years 2008-2030 for the following fuels: • Incremental natural gas in Southcentral Alaska delivered to a utility-scale customer • Incremental diesel delivered to a PCE community utility tank • Incremental diesel delivered to a home in a PCE community • Incremental home heating oil purchased in Anchorage, Fairbanks, Juneau, Kenai, Ketchikan, Palmer, and Wasilla This memorandum provides documentation of the assumptions and methods that we used. Two companion Excel workbooks contain the detailed projections
-

Benefit-Cost Assessment of the Port Mackenzie Rail Extension
Steve Colt and Nick Szymoniak
Costs We assume that the Port MacKenzie rail extension would cost $275 million to construct.1 This is a conservative estimate based on a range of between $200 million and $300 million for different route options. The time horizon runs 50 years from 2012 to 2061. O&M costs are assumed to be $1.5 million per year, with a net present value of $26.1 million. The net present value of all costs using a 5% real discount rate2 and a base year of 2010 is $301.1 million. Benefits The rail extension would provide two distinct types of benefits: 1) It reduces the cost of rail transportation; and 2) It is likely to stimulate significant new mines and other major development. These benefits come from a diverse mix of potential projects – thus a strength of the rail extension is that its economic viability does not depend on any one project. Reduced transportation costs Relative to Seward, using the extension would save 140.7 miles per one-way trip.3 Assuming an average cost savings of 6 cents per ton-mile and a 5.0% real discount rate, we estimate that using the extension would save $572 million in avoided rail costs, avoided port costs, and avoided railroad and road upgrades. These savings are shown in the table and figure on the following page. In addition to the above, we estimate that about 22,000 train crossings of Pittman Road and other roads would be avoided by the extension, saving motorists up to 64,000 vehicle-hours of travel time delay between now and 2061.
-

Economic Impacts of the South Denali Implementation Plan
Steve Colt, Nick Szymoniak, and Ginny Fay
This study estimates the economic effects of carrying out the South Denali Implementation Plan. The plan provides for construction of new visitor facilities in the South Denali Region. ISER economists used the IMPLAN input-output modeling system to project the jobs, income, and sales due to 1) initial construction activity; 2) ongoing operation and maintenance expenses; and 3) additional visitation and visitor spending attributable to the new facilities. The model results include the effects at the Mat-Su Borough and statewide Alaska levels. Local area impacts are also estimated. Suggested Citation: Colt, Steve, Fay, Ginny, Szymoniak, Nick. 2008. Economic Impact of the South Denali Implementation Plan. Prepared for the National Park Service, Denali National Park and Preserve and the Matanuska-Susitna Borough Planning and Land Use Department. Anchorage: University of Alaska Anchorage Institute of Social and Economic Research.
-

Alaska Native Graduates of UAA: What Can They Tell Us?
Diane Erickson and Diane Hirshberg
Alaska Natives make up 9% of students at the University of Alaska Anchorage, and the number attending classes on the Anchorage campus is up more than 40% since 2000—from 950 to nearly 1,400. But despite that fast growth, few Alaska Native students go on to graduate. Less than 5% of the students earning bachelor’s degrees at UAA in 2007 were Alaska Native. And as Figure 1 shows, only about one in 10 of the Native students who were freshmen in 2000 had earned bachelor’s degrees six years later, in 2006. Alaska Native students begin leaving at high rates in their second year at UAA. Among those who started in 2005, less than 60% of the Native freshmen but 70% of all freshmen went on to the next year. Still, that was an improvement over 2000, when only about half the Alaska Native freshmen continued on to their second year (Figure 1). The low graduation rates among Native students—not only at UAA but throughout the University of Alaska—are worrisome. Alaska Natives are under-represented in teaching, health care, business, and many other professions—and that won’t change until more Alaska Native students get the educational credentials they need. But what about those Alaska Native students who do succeed in earning bachelor’s and master’s degrees and doctorates? What keeps them going, when so many others don’t make it to graduation?
-

How Vulnerable Is Alaska’s Economy to Reduced Federal Spending?
Oliver Scott Goldsmith
About a third of all jobs in Alaska can be traced to federal spending here—and over the past decade the rapid increase in federal spending drove much of the economic growth. Federal spending in Alaska more than doubled between 1995 and 2005, and in 2006 it was $9.25 billion. But now federal spending here has stopped growing, and many Alaskans are worried that the economy is vulnerable to spending cuts as the federal budget tightens. This analysis estimates that Alaska could be vulnerable to federal spending cuts in the range of $450 million to $1.25 billion—which could cost the economy anywhere from about 7,000 to 20,000 jobs in the future. We estimate potential vulnerability as a range, because it’s impossible to predict with any precision how federal spending will actually change. The best we can do is estimate the likely magnitude of reductions, given federal budget problems. Any cuts will likely be made gradually, over time, and recent strength in the petroleum and mining sectors will help cushion the effects.
Printing is not supported at the primary Gallery Thumbnail page. Please first navigate to a specific Image before printing.

 by James Edwin and Virgene Hanna")
